
| This section is for the storm chasing data and warnings links. If you are a storm chaser or weather enthusiast, then this page should contain many great links to important weather information. On this page, there are quick and direct links to model runs, watches / warning information, radar imagery, and satellite data to name just a few! This page has been made simple as possible so it can load fast on slower connections. The links on this page are for sites that are not part of Sky-Chaser.com, so if one or more of the links does not work, please let me know! I hope you find the information links on this page useful, especially during that all-important "data-stop" on the road! |
This page has been re-designed for 2020 to include an incredible amount of weather information for storm chasers! If you feel you might be able to suggest any comments or changes, or even report a missing link, please do not hesitate to ask me.
Use the table above, in outline format, to jump directly to the location on this page of your interest. This page is fairly large, so this "table of contents" section was provided. Click on the "LINK##" link on the left, where ## is a number, to jump to that section. To jump to the provider's web site for that section (such as SPC or NWS), click the link to the far right if one is provided. You can also click the top of the underlined section title link to go to the first section in that area.
| CODE | REGION-COVERED | CENTERED-OVER | VIS-IMG | VIS-LOOP | IR-IMG | IR-LOOP | WV-IMG | WV-LOOP | MS-IMG | MS-LOOP |
| USA | US Entire Continental United States | CONUS | VIS | VISL | IR | IRL | WV | WVL | MS | MSL |
| ABI | US Southern Plains | Texas | VIS | VISL | IR | IRL | WV | WVL | MS | MSL |
| ABQ | US Desert Southwest Region | Arizona | VIS | VISL | IR | IRL | WV | WVL | MS | MSL |
| AK | Alaska Region | Alaska | VIS | VISL | IR | IRL | WV | WVL | MS | MSL |
| ALB | US Northeastern Region | New York | VIS | VISL | IR | IRL | WV | WVL | MS | MSL |
| BWI | US Mid-Atlantic Region | Baltimore | VIS | VISL | IR | IRL | WV | WVL | MS | MSL |
| CLT | US Eastern Region | North Carolina | VIS | VISL | IR | IRL | WV | WVL | MS | MSL |
| COD | US Northern Rockies | Wyoming | VIS | VISL | IR | IRL | WV | WVL | MS | MSL |
| DEN | US Central Rockies | Colorado | VIS | VISL | IR | IRL | WV | WVL | MS | MSL |
| DLH | US Northern Midwest Region | Wisconsin | VIS | VISL | IR | IRL | WV | WVL | MS | MSL |
| DTW | US Great Lakes Region | Michigan | VIS | VISL | IR | IRL | WV | WVL | MS | MSL |
| EVV | US Ohio Valley Region | Indiana | VIS | VISL | IR | IRL | WV | WVL | MS | MSL |
| GLF | Gulf Of Mexico | Yucatan | VIS | VISL | IR | IRL | WV | WVL | MS | MSL |
| HI | Hawaii Region | Hawaii | VIS | VISL | IR | IRL | WV | WVL | MS | MSL |
| HMO | Northwestern Mexico | Sonora Region | VIS | VISL | IR | IRL | WV | WVL | MS | MSL |
| ICT | US Central Plains | Kansas | VIS | VISL | IR | IRL | WV | WVL | MS | MSL |
| LAS | US Pacific Southwest Region | California | VIS | VISL | IR | IRL | WV | WVL | MS | MSL |
| LIT | US Lower Mississippi Valley | Arkansas | VIS | VISL | IR | IRL | WV | WVL | MS | MSL |
| LOV | Northeastern Mexico | Rio Grande | VIS | VISL | IR | IRL | WV | WVL | MS | MSL |
| LWS | US Pacific Northwest Region | Washington | VIS | VISL | IR | IRL | WV | WVL | MS | MSL |
| MEX | Southern Mexico | Mexico City | VIS | VISL | IR | IRL | WV | WVL | MS | MSL |
| MGM | US Southeastern Region | Alabama | VIS | VISL | IR | IRL | WV | WVL | MS | MSL |
| MZT | Western Mexico | Sea Of Cortez | VIS | VISL | IR | IRL | WV | WVL | MS | MSL |
| PIR | US Northern Plains | South Dakota | VIS | VISL | IR | IRL | WV | WVL | MS | MSL |
| SJU | Puerto Rico | San Juan | VIS | VISL | IR | IRL | WV | WVL | MS | MSL |
| TPA | US Florida Region | Florida | VIS | VISL | IR | IRL | WV | WVL | MS | MSL |
| WMC | US Pacific West Region | Oregon | VIS | VISL | IR | IRL | WV | WVL | MS | MSL |
| UPN | Southwestern Mexico | Alcalpoco | VIS | VISL | IR | IRL | WV | WVL | MS | MSL |
The table above is for satellite images by region and offers products such as visible (VIS), infra-red (IR), water vapor (WV), multi-spectral (MS), as well as 3-hour loops of such. Simply click on the link for image you wish to view for any of the regions available. All links in the table above have been provided by the NATIONAL CENTER FOR ATMOSPHERIC RESEARCH site and the link to their site has been provided HERE.
This section has been removed due to constant blocking and changes on the ADDS / Aviation services NWS site! Please click HERE for the main page for more reliable satellite imagerty. This satellite channel imagery was originally been provided by the NWS AVIATION WEATHER SERVICES (ADDS) and the link to their site is provided HERE.
| STATE | CODE | REGION-COVERED | BASE-REFL | |
| AL | BMX | BIRMINGHAM | BR | LOOP |
| AL | EOX | FORT RUCKER | BR | LOOP |
| AL | HTX | NORTHERN ALABAMA | BR | LOOP |
| AL | MOB | MOBILE | BR | LOOP |
| AL | MXX | EASTERN ALABAMA | BR | LOOP |
| AK | ABC | BETHEL | BR | LOOP |
| AK | ACG | SITKA | BR | LOOP |
| AK | AEC | NOME | BR | LOOP |
| AK | AHG | KENAI | BR | LOOP |
| AK | AIH | MIDDLETON ISLAND | BR | LOOP |
| AK | AKC | KING SALMON | BR | LOOP |
| AK | APD | PEDRO DOME | BR | LOOP |
| AZ | EMX | TUCSON | BR | LOOP |
| AZ | FSX | FLAGSTAFF | BR | LOOP |
| AZ | IWA | PHOENIX | BR | LOOP |
| AZ | YUX | YUMA | BR | LOOP |
| AR | LZK | LITTLE ROCK | BR | LOOP |
| AR | SRX | FORT SMITH | BR | LOOP |
| CA | BBX | BEALE AFB | BR | LOOP |
| CA | BHX | EUREKA | BR | LOOP |
| CA | DAX | SACRAMENTO | BR | LOOP |
| CA | EYX | EDWARDS AFB | BR | LOOP |
| CA | HNX | SAN JOAQUIN VALLEY | BR | LOOP |
| CA | MUX | SAN FRANCISCO | BR | LOOP |
| CA | NKX | SAN DIEGO | BR | LOOP |
| CA | SOX | SANTA ANA MOUNTAINS | BR | LOOP |
| CA | VBX | VANDENBERG AFB | BR | LOOP |
| CA | VTX | LOS ANGELES | BR | LOOP |
| CO | FTG | DENVER | BR | LOOP |
| CO | GJX | GRAND JUNCTION | BR | LOOP |
| CO | PUX | PUEBLO | BR | LOOP |
| DE | DOX | DOVER AFB | BR | LOOP |
| FL | BYX | KEY WEST | BR | LOOP |
| FL | AMX | MIAMI | BR | LOOP |
| FL | EVX | NW FLORIDA (EGLIN AFB) | BR | LOOP |
| FL | JAX | JACKSONVILLE | BR | LOOP |
| FL | MLB | MELBOURNE | BR | LOOP |
| FL | TBW | TAMPA BAY AREA | BR | LOOP |
| FL | TLH | TALLAHASSEE | BR | LOOP |
| GA | FFC | ATLANTA | BR | LOOP |
| GA | JGX | ROBINS AFB | BR | LOOP |
| GA | VAX | MOODY AFB | BR | LOOP |
| GUAM | GUA | ANDERSEN AFB | BR | LOOP |
| HI | HKI | KAUAI | BR | LOOP |
| HI | HKM | KOHALA | BR | LOOP |
| HI | HMO | MOLOKAI | BR | LOOP |
| HI | HWA | SOUTH SHORE | BR | LOOP |
| ID | CBX | BOISE | BR | LOOP |
| ID | SFX | POCATELLO | BR | LOOP |
| IL | ILX | CENTRAL IL | BR | LOOP |
| IL | LOT | CHICAGO | BR | LOOP |
| IN | IND | INDIANAPOLIS | BR | LOOP |
| IN | IWX | NORTHERN INDIANA | BR | LOOP |
| IN | VWX | EVANSVILLE | BR | LOOP |
| IA | DMX | DES MOINES | BR | LOOP |
| IA | DVN | QUAD CITIES | BR | LOOP |
| KS | DDC | DODGE CITY | BR | LOOP |
| KS | GLD | GOODLAND | BR | LOOP |
| KS | ICT | WICHITA | BR | LOOP |
| KS | TWX | TOPEKA | BR | LOOP |
| KY | HPX | FORT CAMBELL | BR | LOOP |
| KY | JKL | JACKSON | BR | LOOP |
| KY | LVX | LOUISVILLE | BR | LOOP |
| KY | PAH | PADUCAH | BR | LOOP |
| LA | LCH | LAKE CHARLES | BR | LOOP |
| LA | LIX | NEW ORLEANS | BR | LOOP |
| LA | POE | FORT POLK | BR | LOOP |
| LA | SHV | SHREVEPORT | BR | LOOP |
| ME | CBW | CARIBOU | BR | LOOP |
| ME | GYX | PORTLAND | BR | LOOP |
| MD | LWX | BALTIMORE (WASHINGTON DC) | BR | LOOP |
| MA | BOX | BOSTON | BR | LOOP |
| MI | APX | GAYLORD | BR | LOOP |
| MI | DTX | DETROIT | BR | LOOP |
| MI | GRR | GRAND RAPIDS | BR | LOOP |
| MI | MQT | MARQUETTE | BR | LOOP |
| MN | DLH | DULUTH | BR | LOOP |
| MN | MPX | MINNEAPOLIS | BR | LOOP |
| MS | DGX | JACKSON | BR | LOOP |
| MS | GWX | COLUMBUS AFB | BR | LOOP |
| MO | EAX | KANSAS CITY | BR | LOOP |
| MO | LSX | SAINT LOUIS | BR | LOOP |
| MO | SGF | SPRINGFIELD | BR | LOOP |
| MT | BLX | BILLINGS | BR | LOOP |
| MT | GGW | GLASGOW | BR | LOOP |
| MT | MSX | MISSOULA | BR | LOOP |
| MT | TFX | GREAT FALLS | BR | LOOP |
| NC | LTX | WILMINGTON | BR | LOOP |
| NC | MHX | MOREHEAD CITY | BR | LOOP |
| NC | RAX | RALEIGH / DURHAM | BR | LOOP |
| ND | BIS | BISMARCK | BR | LOOP |
| ND | MBX | MINOT AFB | BR | LOOP |
| ND | MVX | GRAND FORKS | BR | LOOP |
| NE | LNX | NORTH PLATTE | BR | LOOP |
| NE | OAX | OMAHA | BR | LOOP |
| NE | UEX | HASTINGS | BR | LOOP |
| NJ | DIX | MOUNT HOLLY | BR | LOOP |
| NM | ABX | ALBUQUERQUE | BR | LOOP |
| NM | FDX | CANNON AFB | BR | LOOP |
| NM | HDX | HOLLOMAN AFB | BR | LOOP |
| NV | ESX | LAS VEGAS | BR | LOOP |
| NV | LRX | ELKO | BR | LOOP |
| NV | RGX | RENO | BR | LOOP |
| NY | BGM | BINGHAMTON | BR | LOOP |
| NY | BUF | BUFFALO | BR | LOOP |
| NY | ENX | ALBANY | BR | LOOP |
| NY | OKX | NEW YORK CITY / UPTON | BR | LOOP |
| NY | TYX | MONTAGUE | BR | LOOP |
| OH | CLE | CLEVELAND | BR | LOOP |
| OH | ILN | CINCINNATI / DAYTON | BR | LOOP |
| OK | FDR | FREDERICK | BR | LOOP |
| OK | INX | TULSA | BR | LOOP |
| OK | TLX | OKLAHOMA CITY | BR | LOOP |
| OK | VNX | VANCE AFB | BR | LOOP |
| OR | MAX | MEDFORD | BR | LOOP |
| OR | PDT | PENDLETON | BR | LOOP |
| OR | RTX | PORTLAND | BR | LOOP |
| PA | CCX | STATE COLLEGE | BR | LOOP |
| PA | DIX | PHILADELPHIA | BR | LOOP |
| PA | PBZ | PITTSBURGH | BR | LOOP |
| PR | JUA | SAN JUAN | BR | LOOP |
| SC | CAE | COLUMBIA | BR | LOOP |
| SC | CLX | CHARLESTON | BR | LOOP |
| SC | GSP | GREENVILLE / SPARTANBURG | BR | LOOP |
| SD | ABR | ABERDEEN | BR | LOOP |
| SD | FSD | SIOUX FALLS | BR | LOOP |
| SD | UDX | RAPID CITY | BR | LOOP |
| TN | MRX | KNOXVILLE / MORRISTOWN | BR | LOOP |
| TN | NQA | MEMPHIS | BR | LOOP |
| TN | OHX | NASHVILLE | BR | LOOP |
| TX | AMA | AMARILLO | BR | LOOP |
| TX | BRO | BROWNSVILLE | BR | LOOP |
| TX | CRP | CORPUS CHRISTI | BR | LOOP |
| TX | DFX | LAUGHLIN AFB | BR | LOOP |
| TX | DYX | DYESS AFB | BR | LOOP |
| TX | EPZ | EL PASO | BR | LOOP |
| TX | EWX | AUSTIN / SAN ANTONIO | BR | LOOP |
| TX | FWS | DALLAS / FORT WORTH | BR | LOOP |
| TX | GRK | CENTRAL TEXAS | BR | LOOP |
| TX | HGX | HOUSTON / GALVESTON | BR | LOOP |
| TX | LBB | LUBBOCK | BR | LOOP |
| TX | MAF | MIDLAND | BR | LOOP |
| TX | SJT | SAN ANGELO | BR | LOOP |
| UT | ICX | CEDAR CITY | BR | LOOP |
| UT | MTX | SALT LAKE CITY | BR | LOOP |
| VT | CXX | BURLINGTON | BR | LOOP |
| VA | AKQ | NORFOLK / RICHMOND | BR | LOOP |
| VA | FCX | ROANOKE / BLACKSBURG | BR | LOOP |
| VA | LWX | STERLING | BR | LOOP |
| WA | ATX | SEATTLE / TACOMA | BR | LOOP |
| WA | OTX | SPOKANE | BR | LOOP |
| WV | RLX | CHARLESTON | BR | LOOP |
| WI | ARX | LA CROSSE | BR | LOOP |
| WI | GRB | GREEN BAY | BR | LOOP |
| WI | MKX | MILWAUKEE | BR | LOOP |
| WY | CYS | CHEYENNE | BR | LOOP |
| WY | RIW | RIVERTON | BR | LOOP |
The table above is for all National Weather Service weather radar sites sorted by state (or US commonwealths) with a location code for each state. The radar information is for different products such as base reflectivity, velocity, and such. Each radar product has a two links to click on for either a single image or a loop for that product. Please note that this site is constantly changing and I left only the reflectivity links (fixed many broken opnes) and other products are no longer provided (unless you visit the site and choose enhanced radar using their interactive maps). All links in the table above have been provided by the National Weather Service and the link to their site has been provided HERE.
| CODE | STATION-ID | STATION-LOCATION | CURRENT |
| ABQ | 72365 | Albuquerque, NM | SND |
| ABR | 72659 | Aberdeen, SD | SND |
| ALB | 72518 | Albany, NY | SND |
| AMA | 72363 | Amarillo, TX | SND |
| APX | 72634 | Gaylord, MI | SND |
| BIS | 72764 | Bismarck, ND | SND |
| BNA | 72327 | Nashville, TN | SND |
| BOI | 72681 | Boise, ID | SND |
| BRO | 72250 | Brownsville, TX | SND |
| BUF | 72528 | Buffalo, NY | SND |
| CAR | 72712 | Caribou, ME | SND |
| CHH | 74494 | Chatham, MA | SND |
| CHS | 72208 | Charleston, SC | SND |
| CRP | 72251 | Corpus Christi, TX | SND |
| DDC | 72451 | Dodge City, KS | SND |
| DNR | 72469 | Denver, CO | SND |
| DRT | 72261 | Del Rio, TX | SND |
| DTX | 72632 | Detroit, MI | SND |
| DVN | 74455 | Quad Cities, IA | SND |
| EDW | 74612 | Edwards AFB, CA | SND |
| EPZ | 72364 | El Paso, TX | SND |
| EYW | 72201 | Key West, FL | SND |
| FFC | 72215 | Peachtree City, GA | SND |
| FWD | 72249 | Fort Worth, TX | SND |
| GGW | 72768 | Glasgow, MT | SND |
| GJT | 72476 | Grand Junction, CO | SND |
| GRB | 72645 | Green Bay, WI | SND |
| GSO | 72317 | Greensboro, NC | SND |
| GYX | 74389 | Gray, ME | SND |
| IAD | 72403 | Washington, DC | SND |
| ILN | 72426 | Wilmington, OH | SND |
| ILX | 74560 | Lincoln, IL | SND |
| INL | 72747 | Internation Falls, MN | SND |
| JAN | 72235 | Jackson, MS | SND |
| JAX | 72206 | Jacksonville, FL | SND |
| LBF | 72562 | North Platte, NE | SND |
| LCH | 72240 | Lake Charles, LA | SND |
| LIX | 72233 | Slidell, LA | SND |
| LKN | 72387 | Mercury, NV | SND |
| LZK | 72340 | Little Rock, AR | SND |
| MAF | 72265 | Midland, TX | SND |
| MFL | 72202 | Miami, FL | SND |
| MFR | 72597 | Medford, OR | SND |
| MHX | 72305 | Morehead City, NC | SND |
| MPX | 72649 | Minneapolis, MN | SND |
| NKX | 72293 | San Diego, CA | SND |
| OAK | 72493 | Oakland, CA | SND |
| OAX | 72558 | Omaha, NE | SND |
| OKX | 72501 | Brookhaven, NY | SND |
| OTX | 72785 | Spokane, WA | SND |
| OUN | 72357 | Norman, OK | SND |
| PIT | 72520 | Pittsburgh, PA | SND |
| REV | 72489 | Reno, NV | SND |
| RIW | 72673 | Riverton, WY | SND |
| RNK | 72318 | Roanoke, VA | SND |
| SGF | 72440 | Springfield, MO | SND |
| SHV | 72248 | Shreveport, LA | SND |
| SLC | 72572 | Salt Lake City, UT | SND |
| SLE | 72694 | Salem, OR | SND |
| TBW | 72210 | Tampa Bay, FL | SND |
| TFX | 72776 | Great Falls, MT | SND |
| TLH | 72214 | Tallahassee, FL | SND |
| TOP | 72456 | Topeka, KS | SND |
| TWC | 72274 | Tucson, AZ | SND |
| UIL | 72797 | Quillayute, WA | SND |
| UNR | 72662 | Rapid City, SD | SND |
| VBG | 74606 | Vandenberg, CA | SND |
| WAL | 72402 | Wallops Island, MD | SND |
| XMR | 74794 | Cape Canaveral, FL | SND |
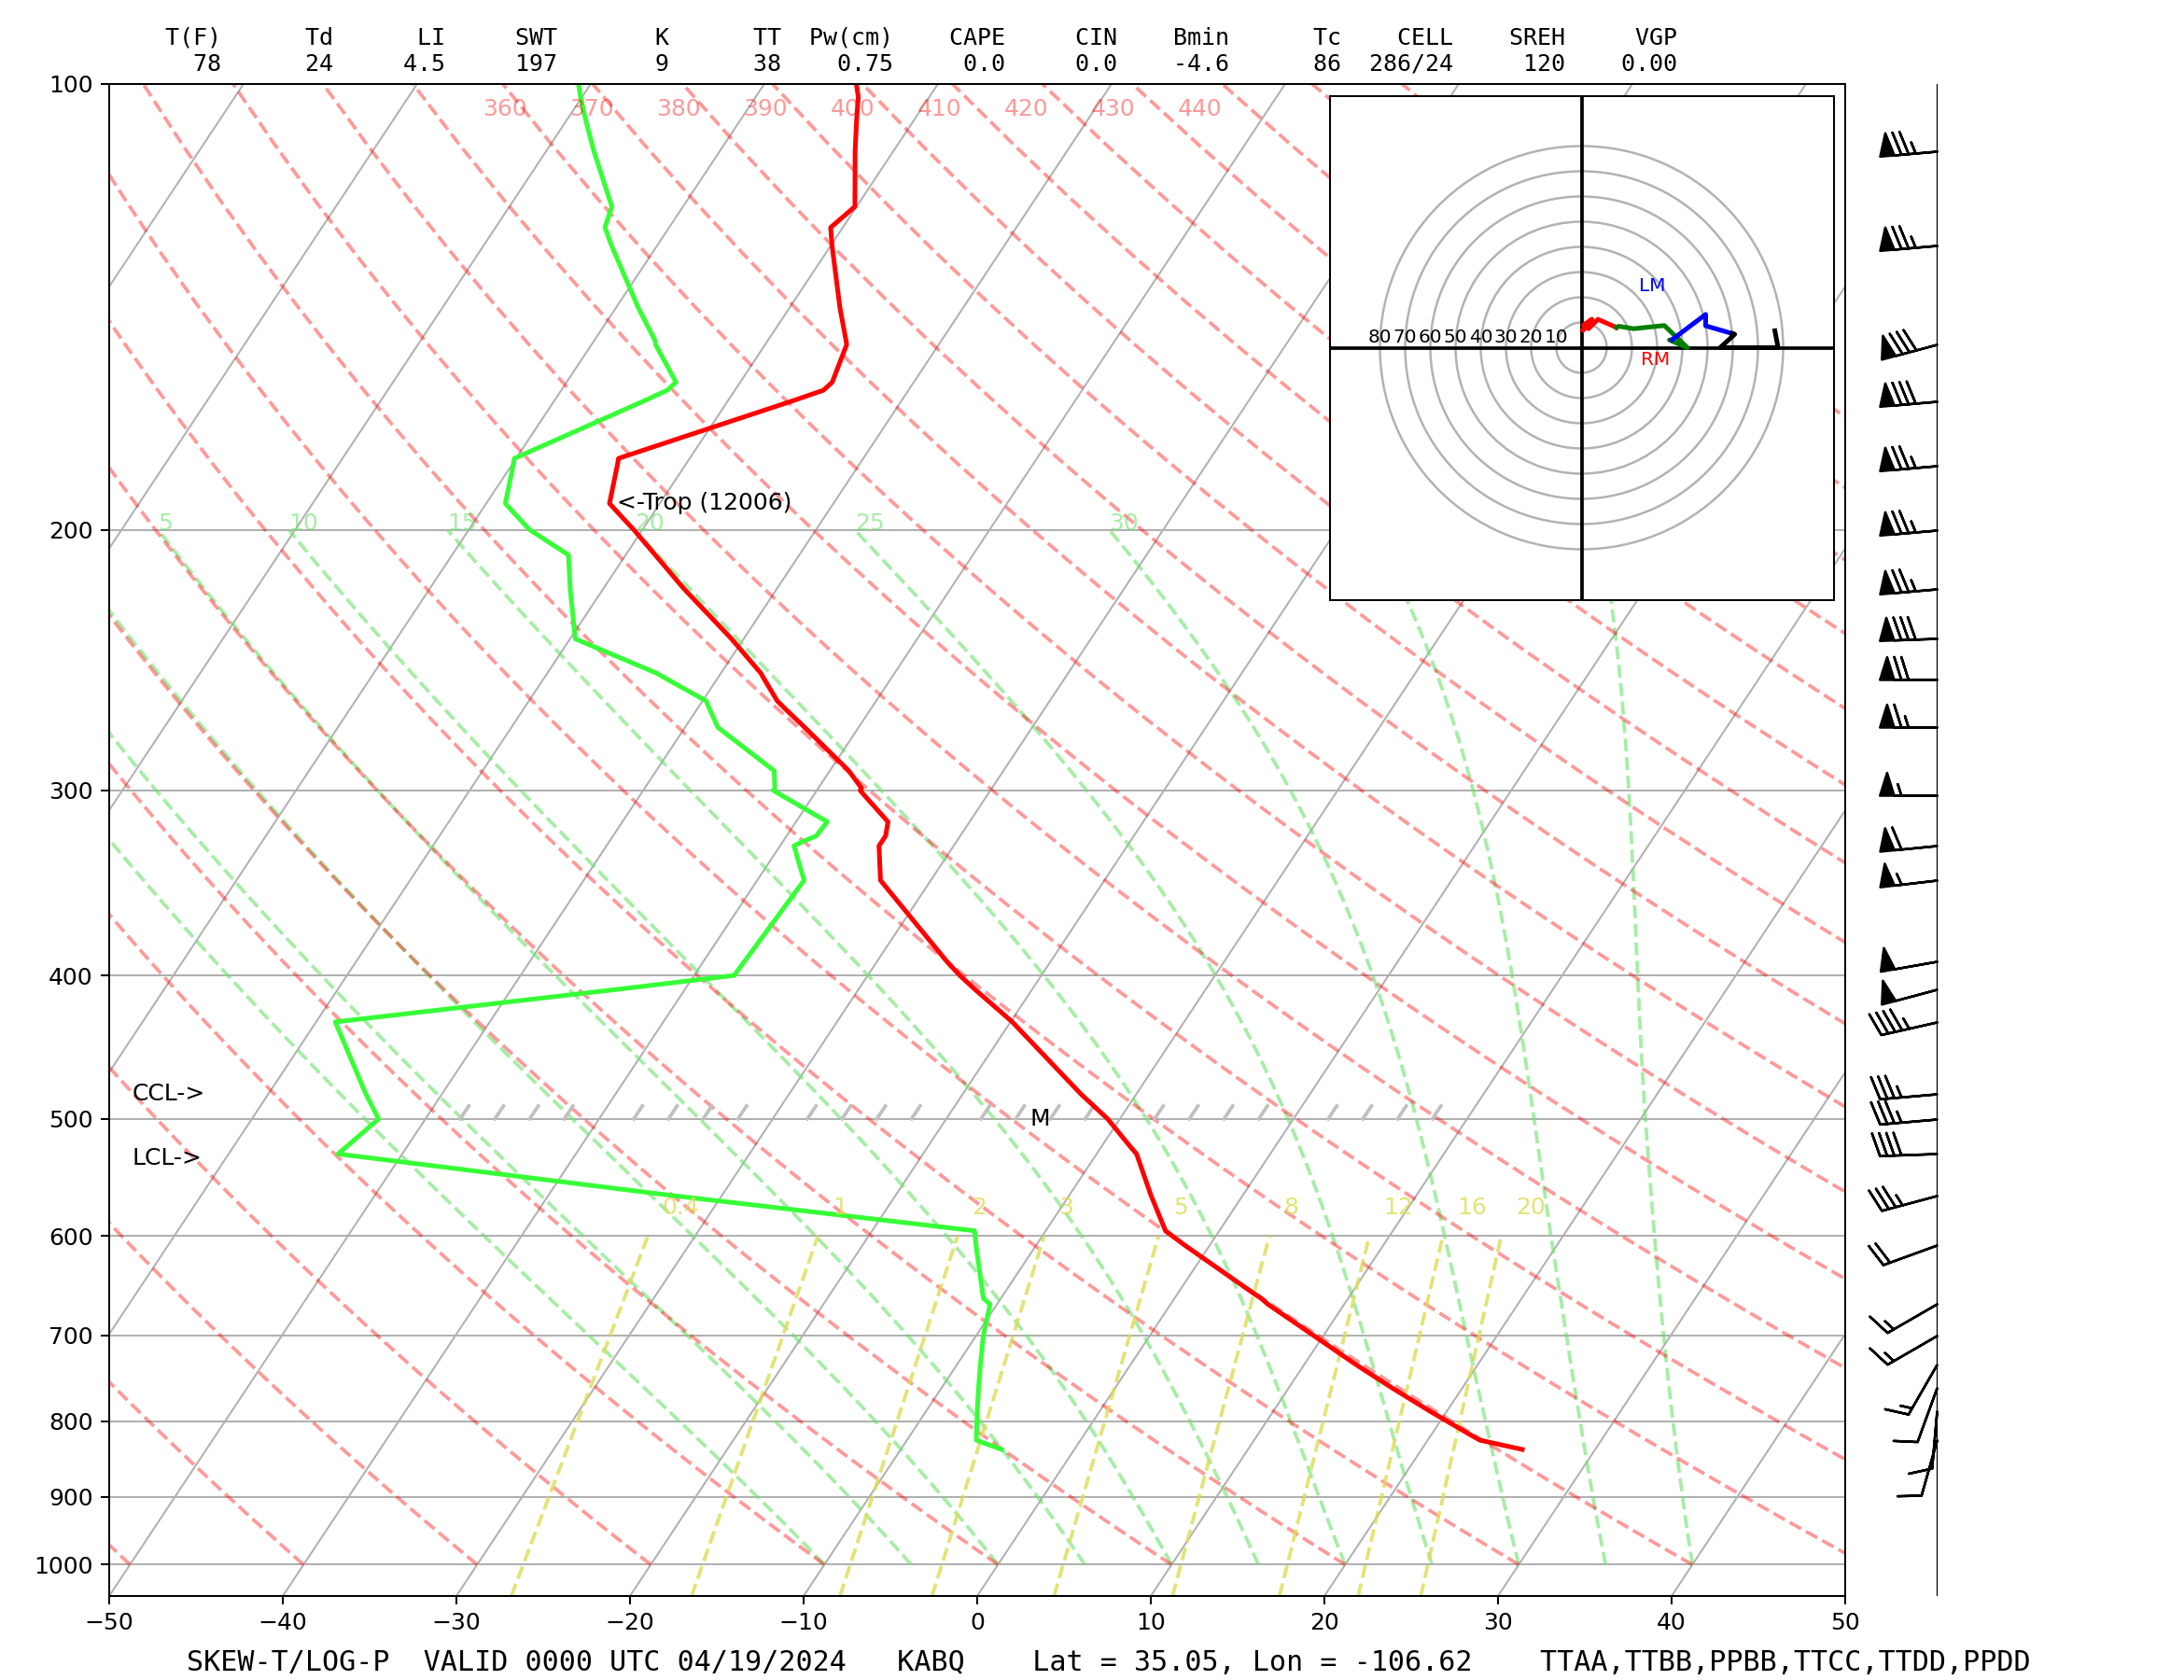
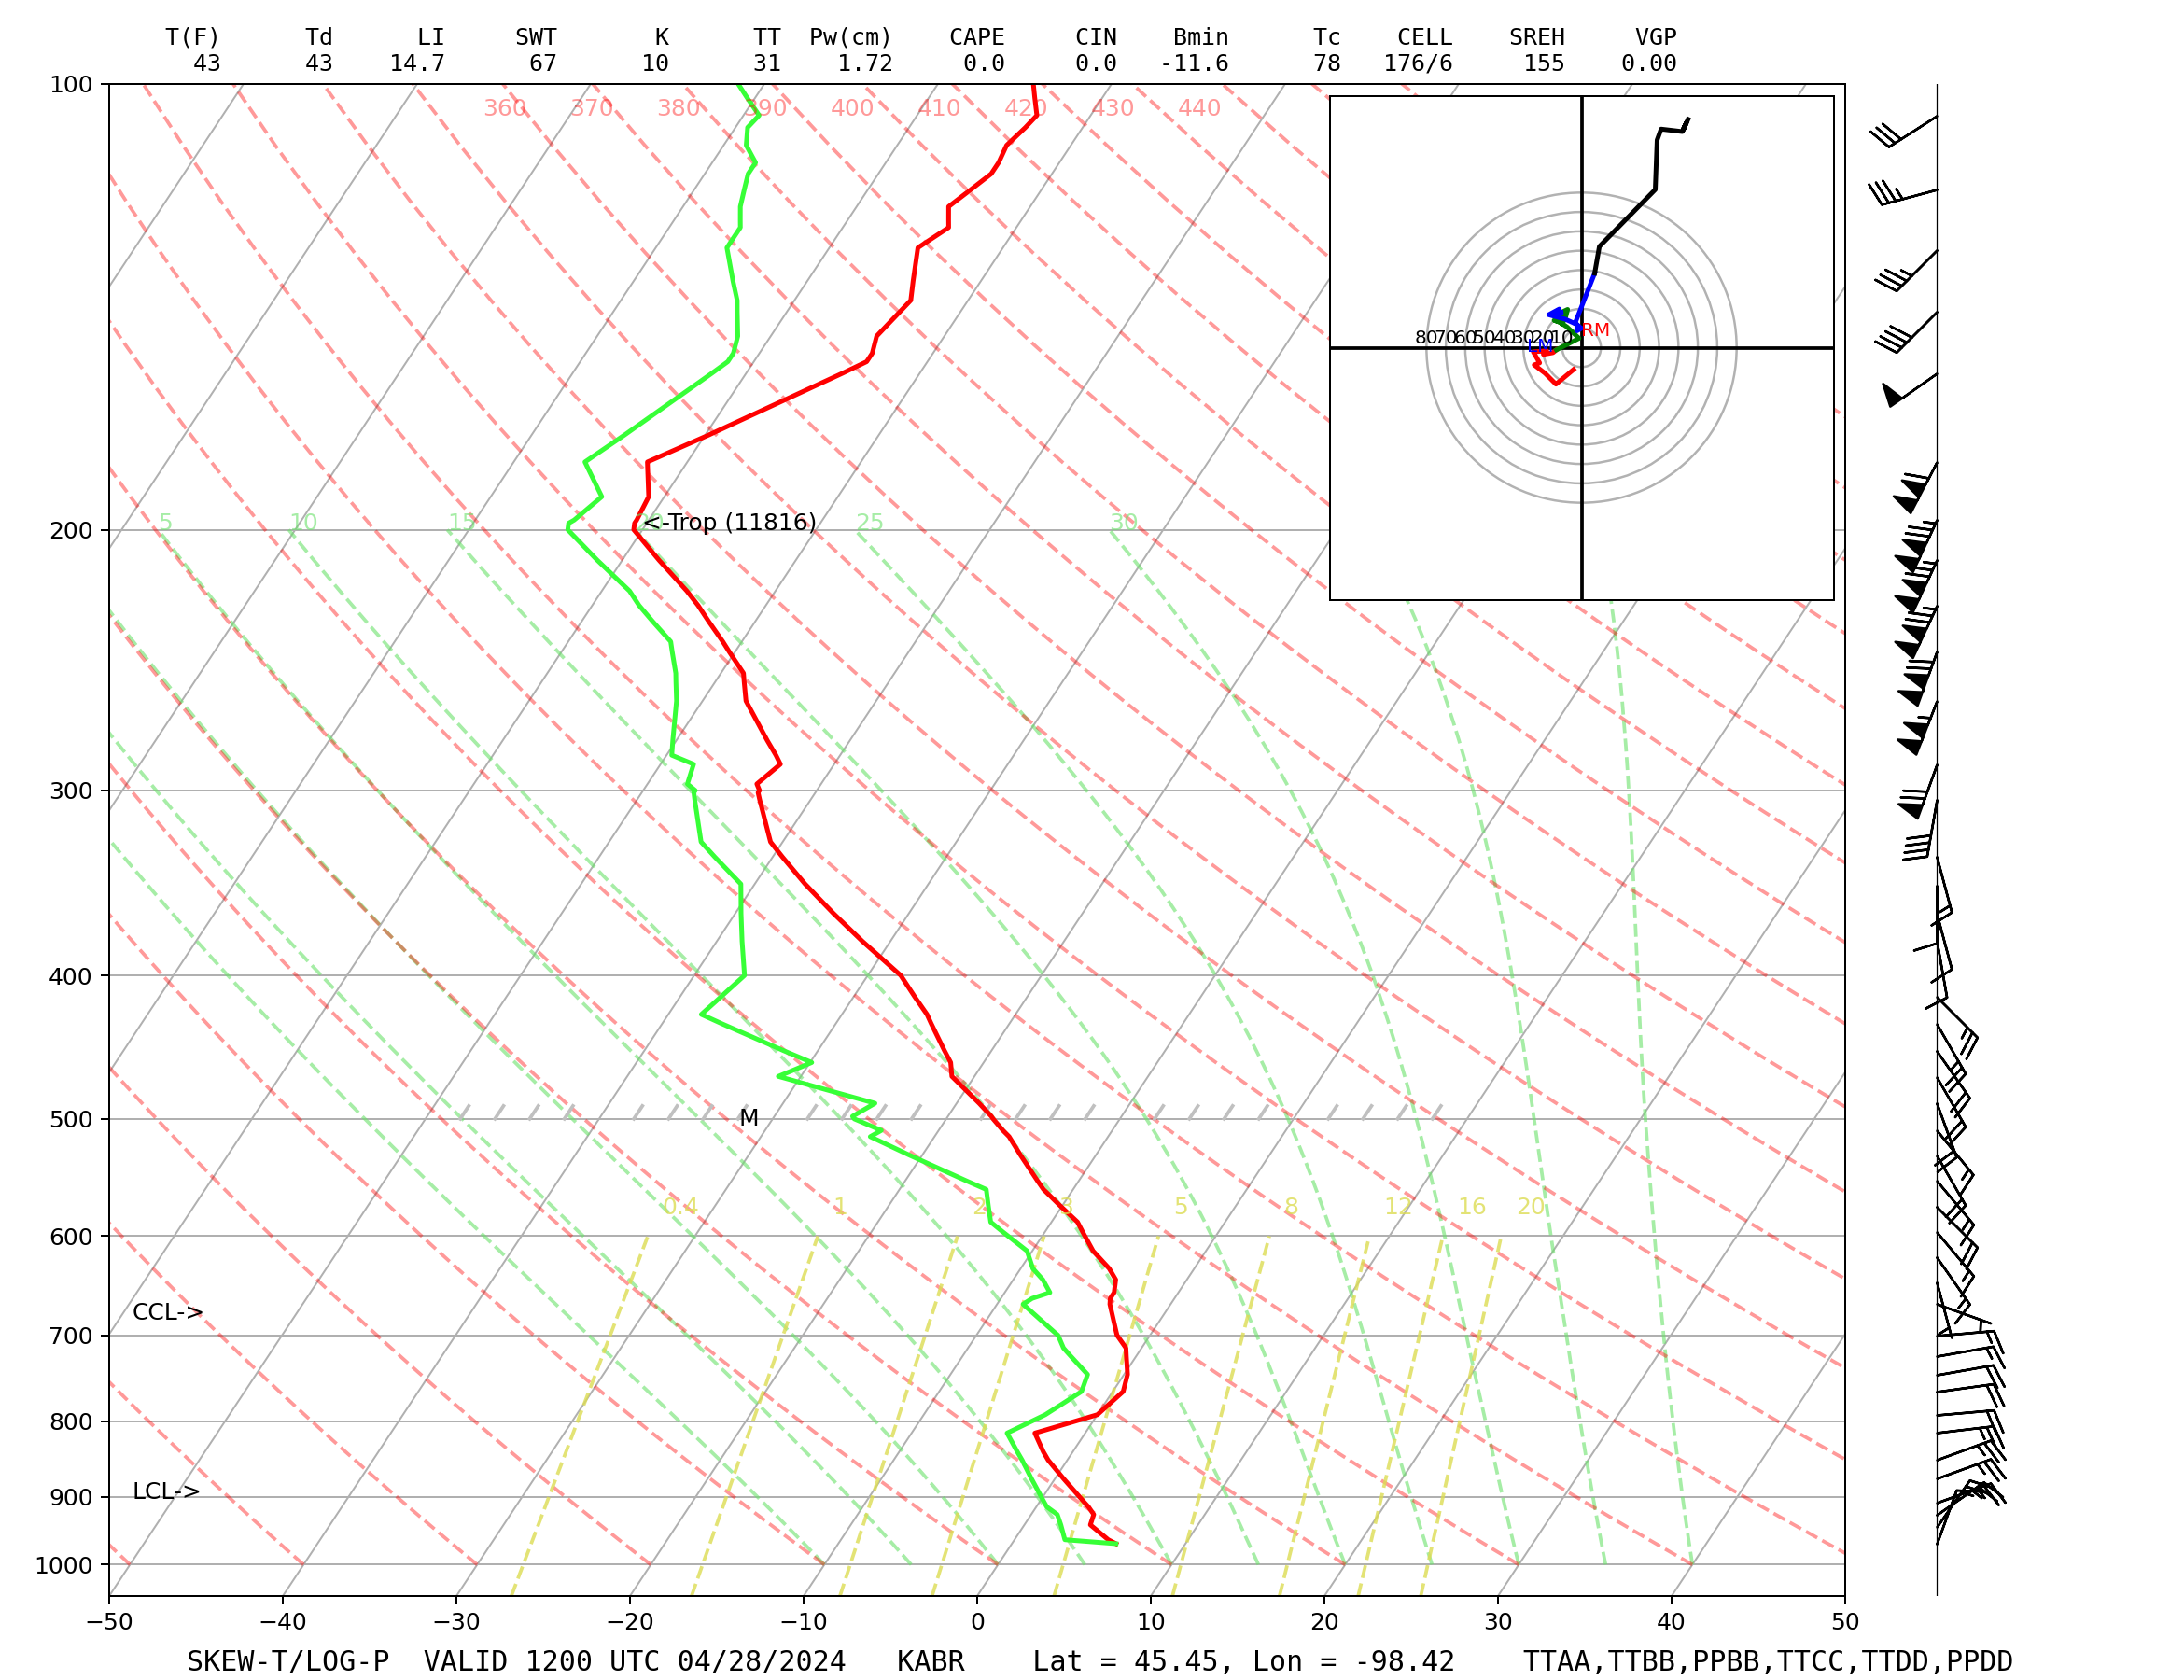
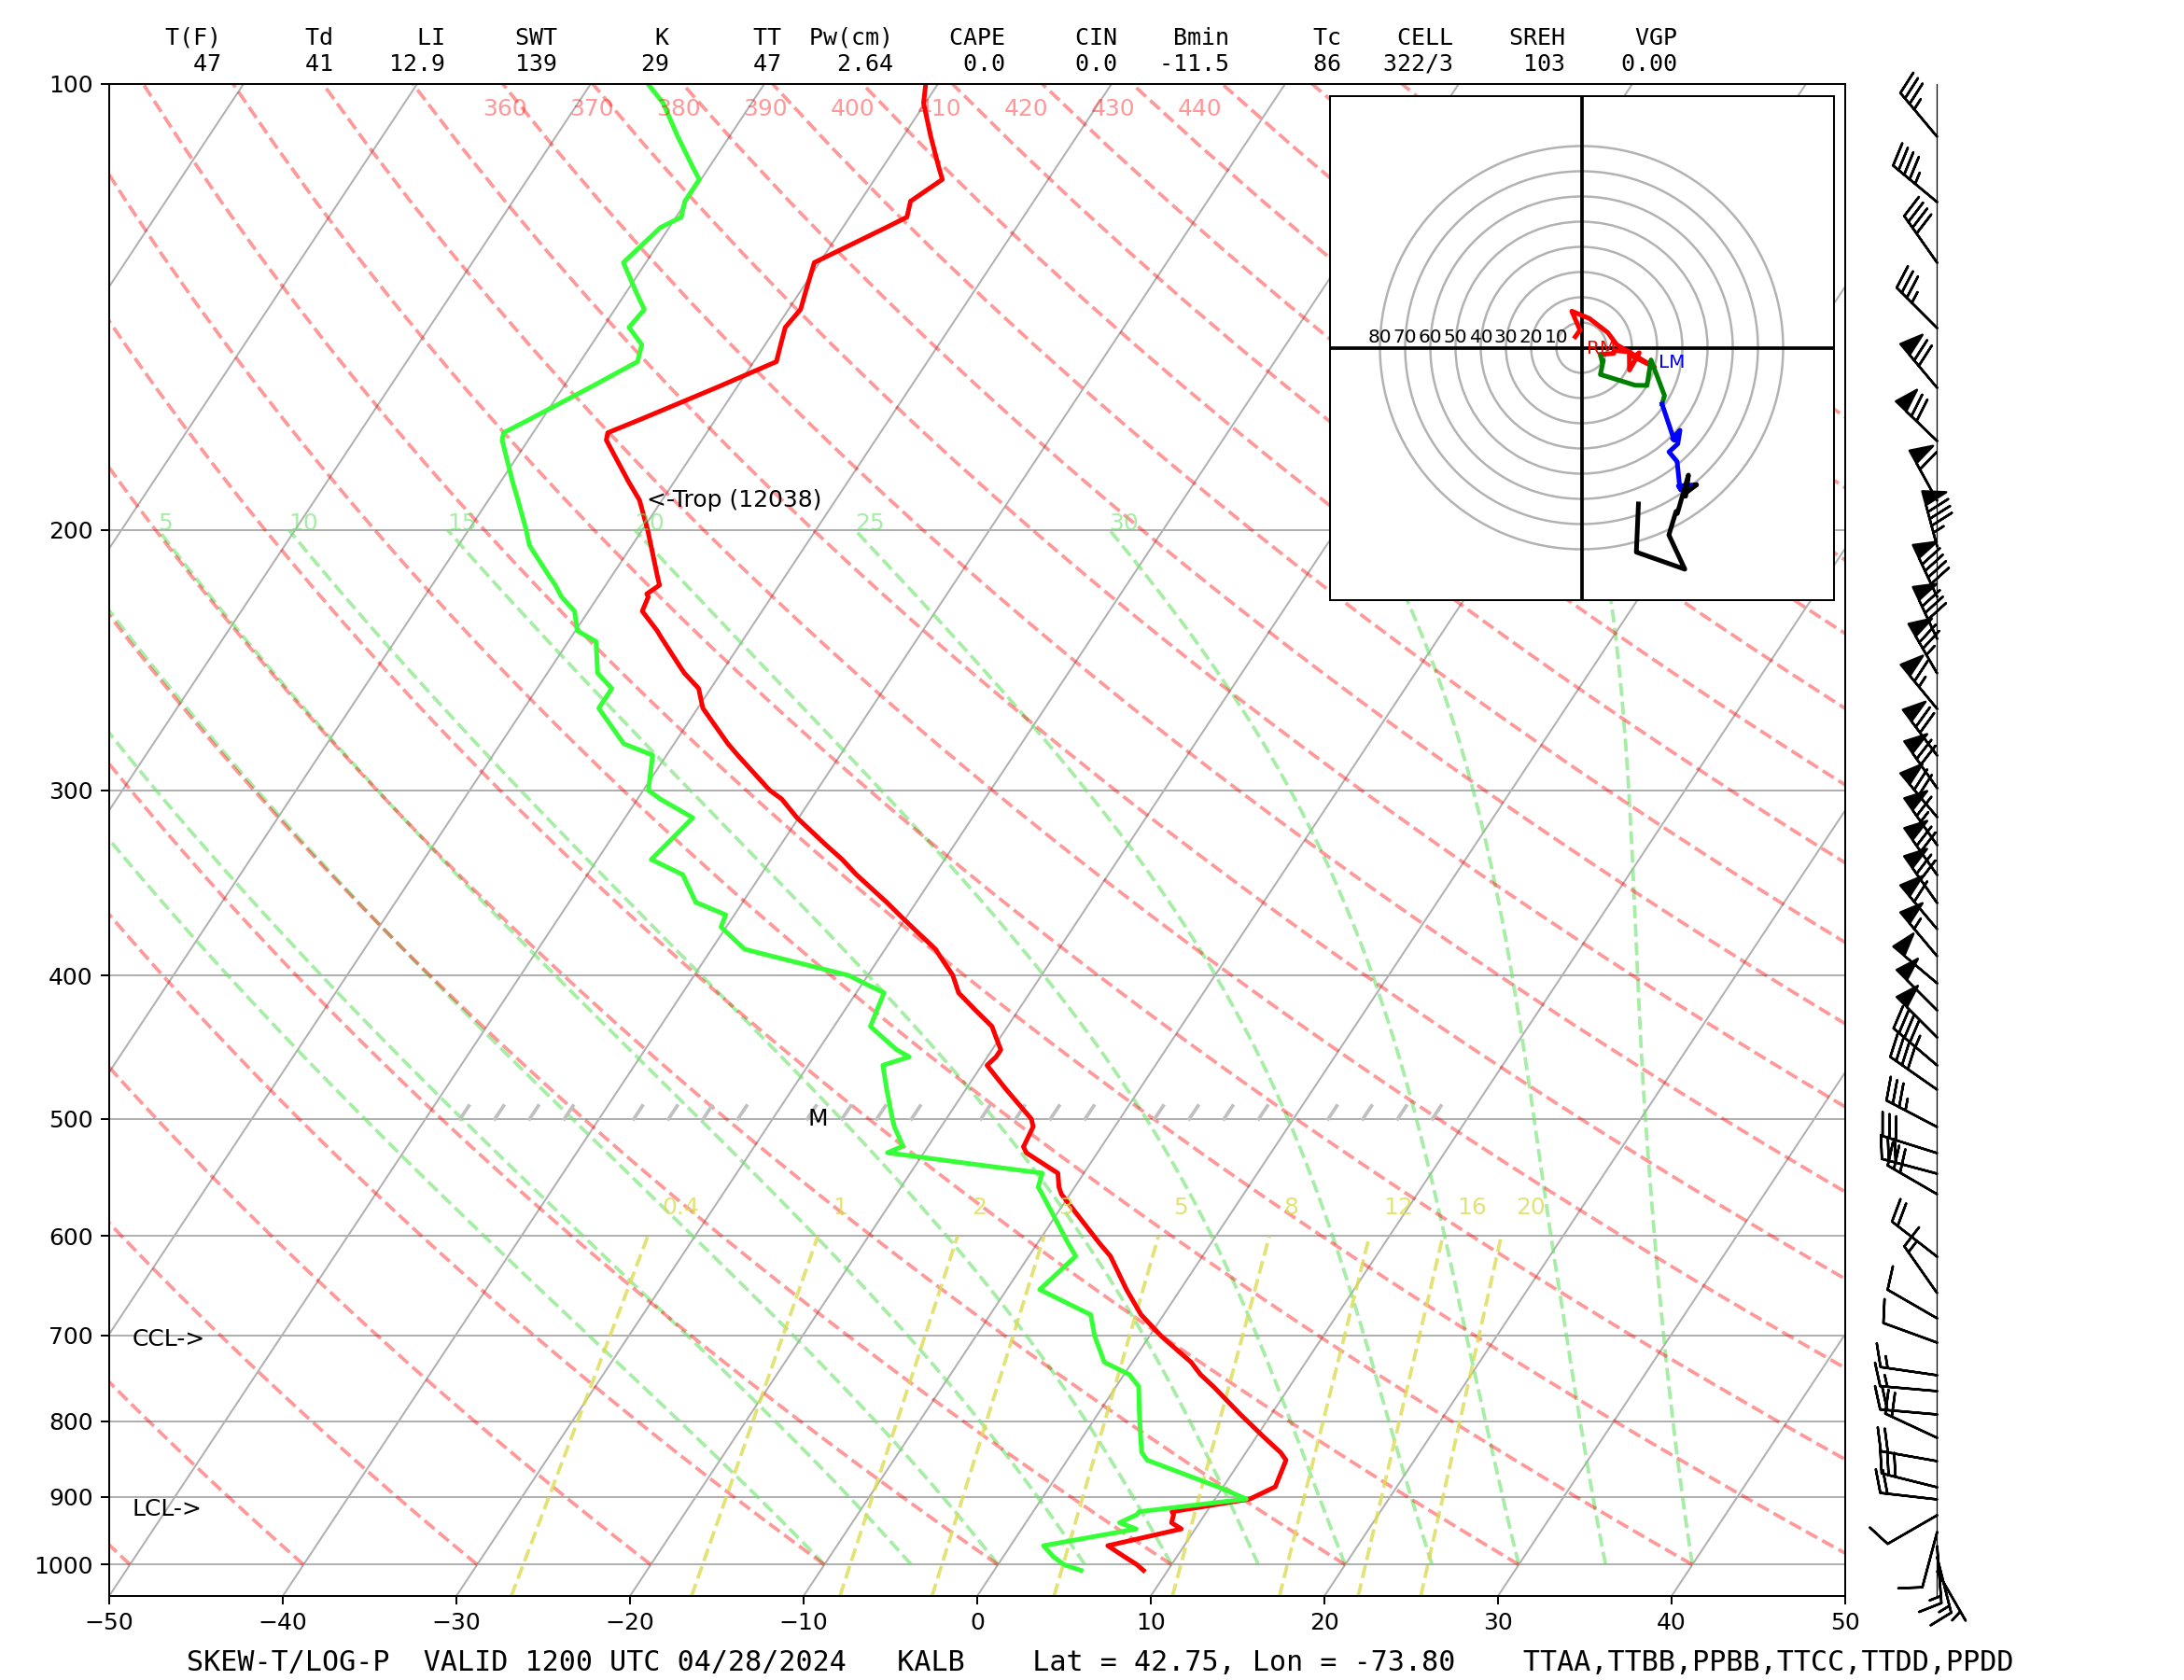
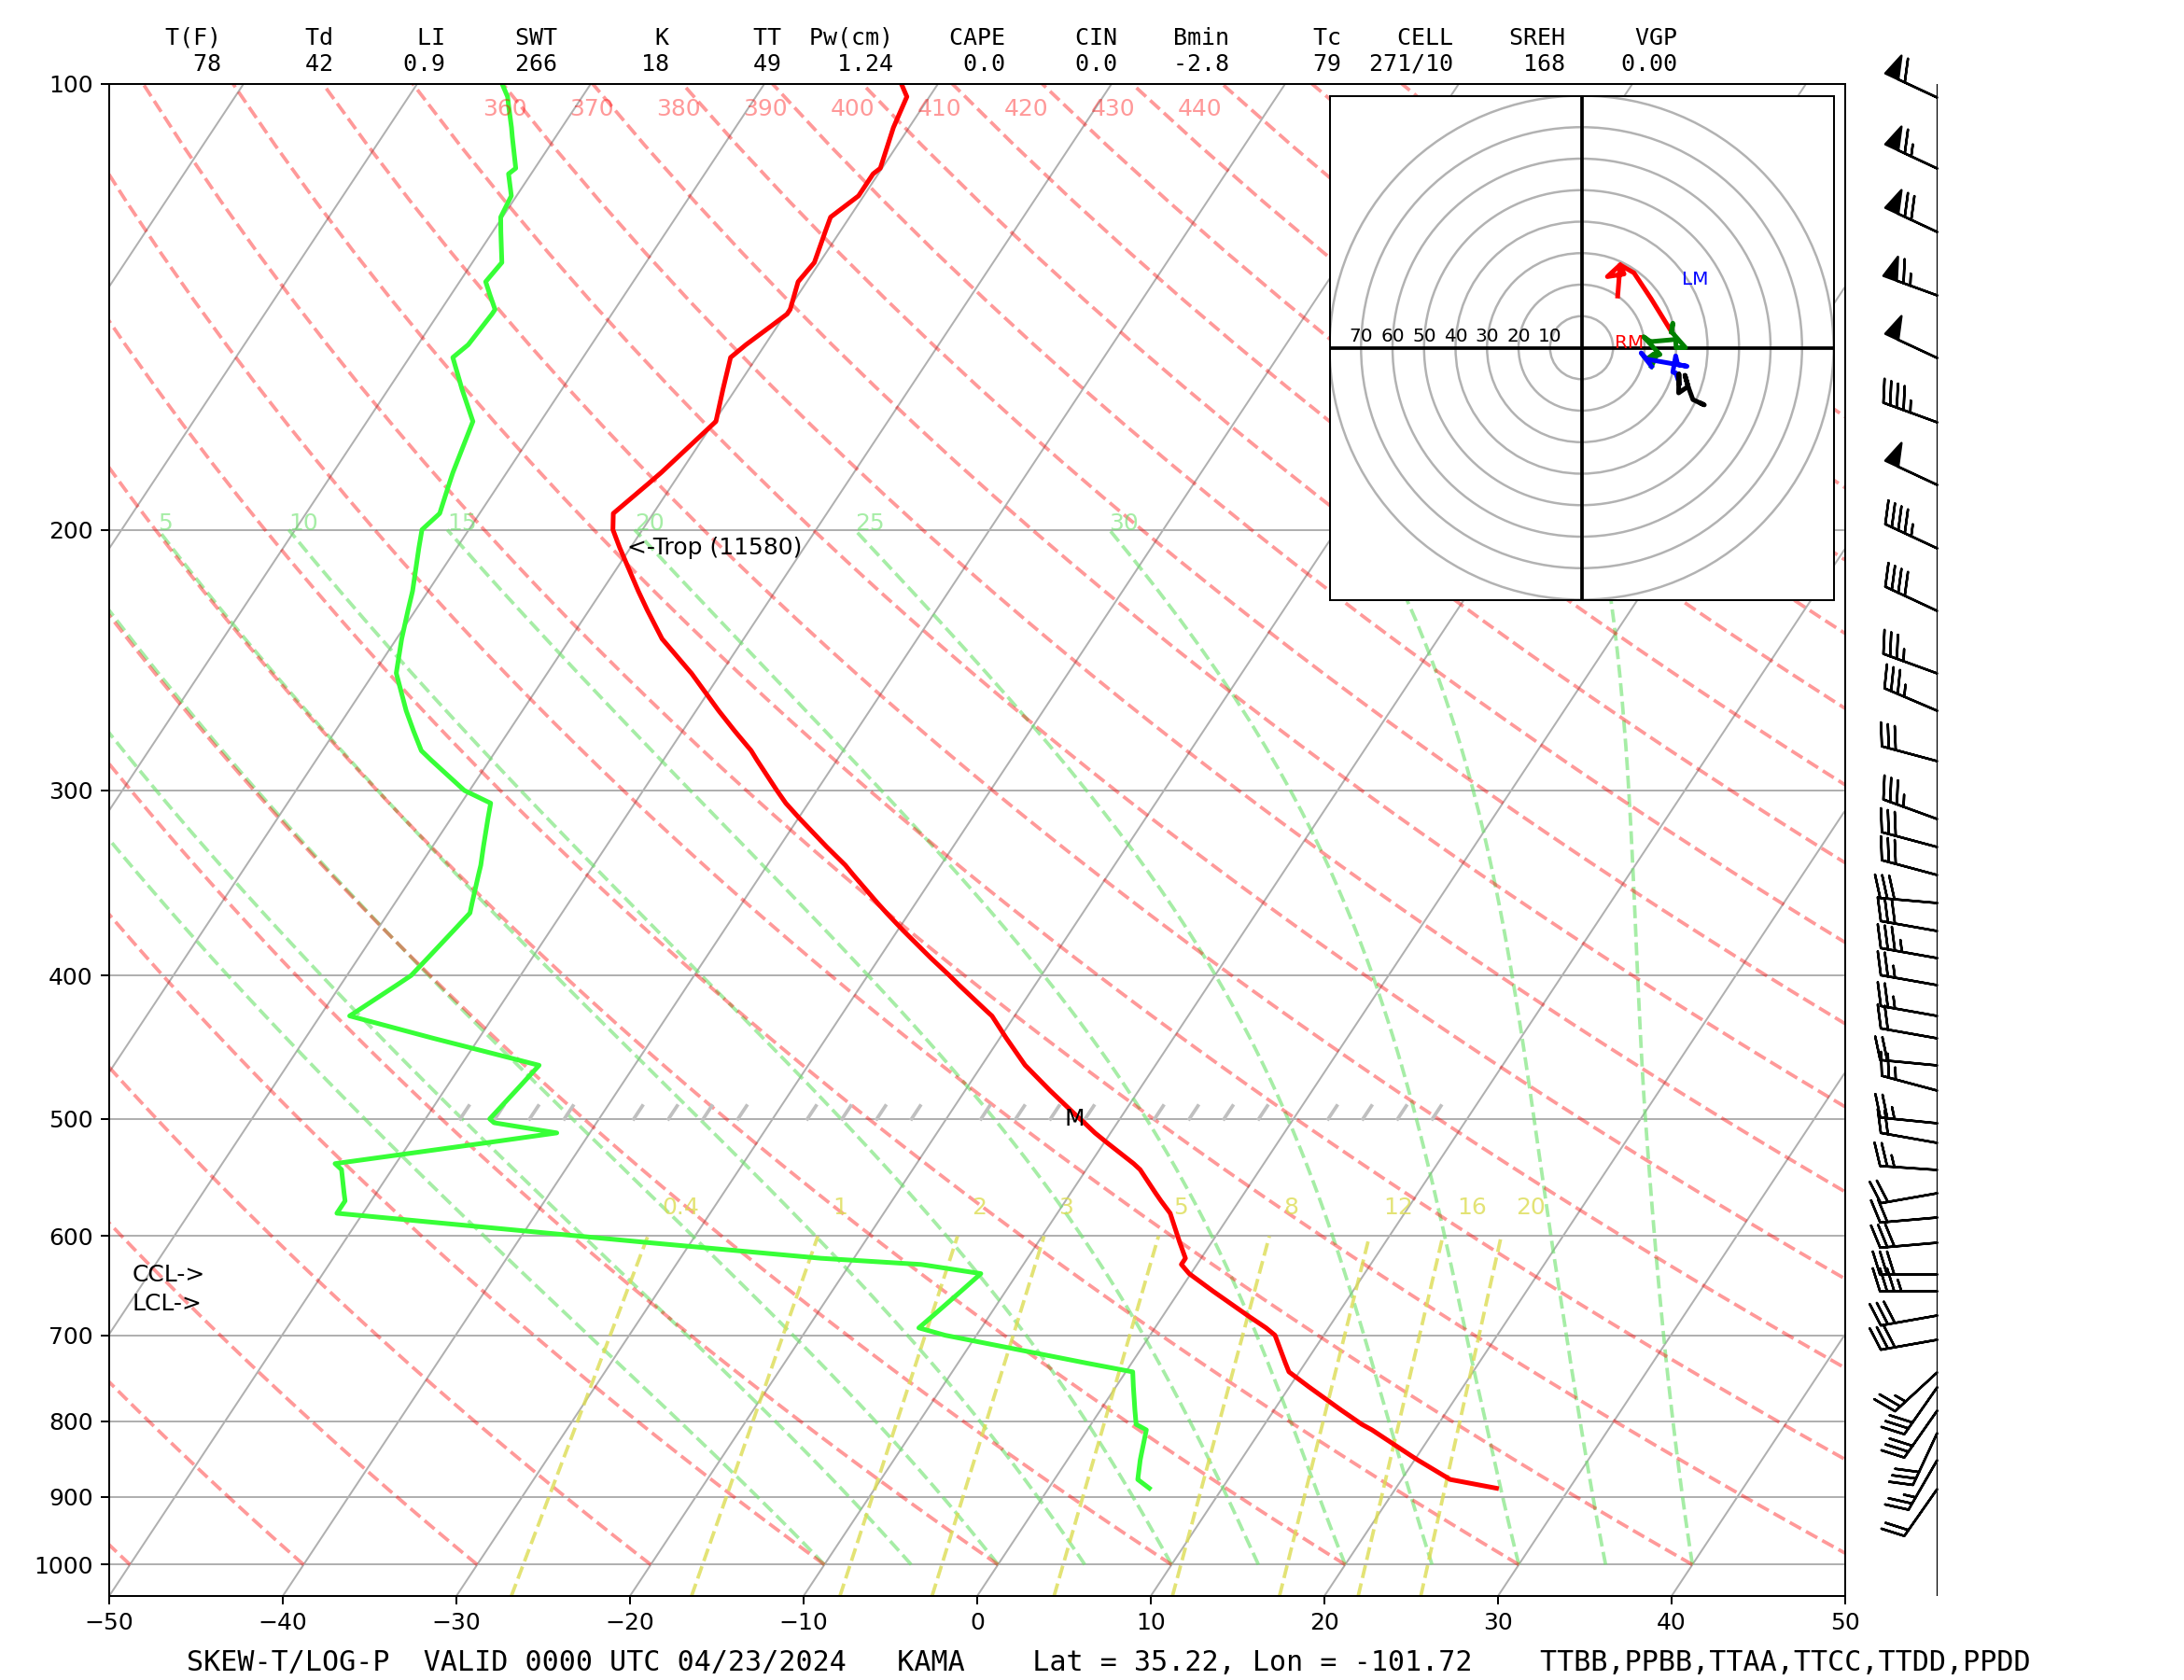
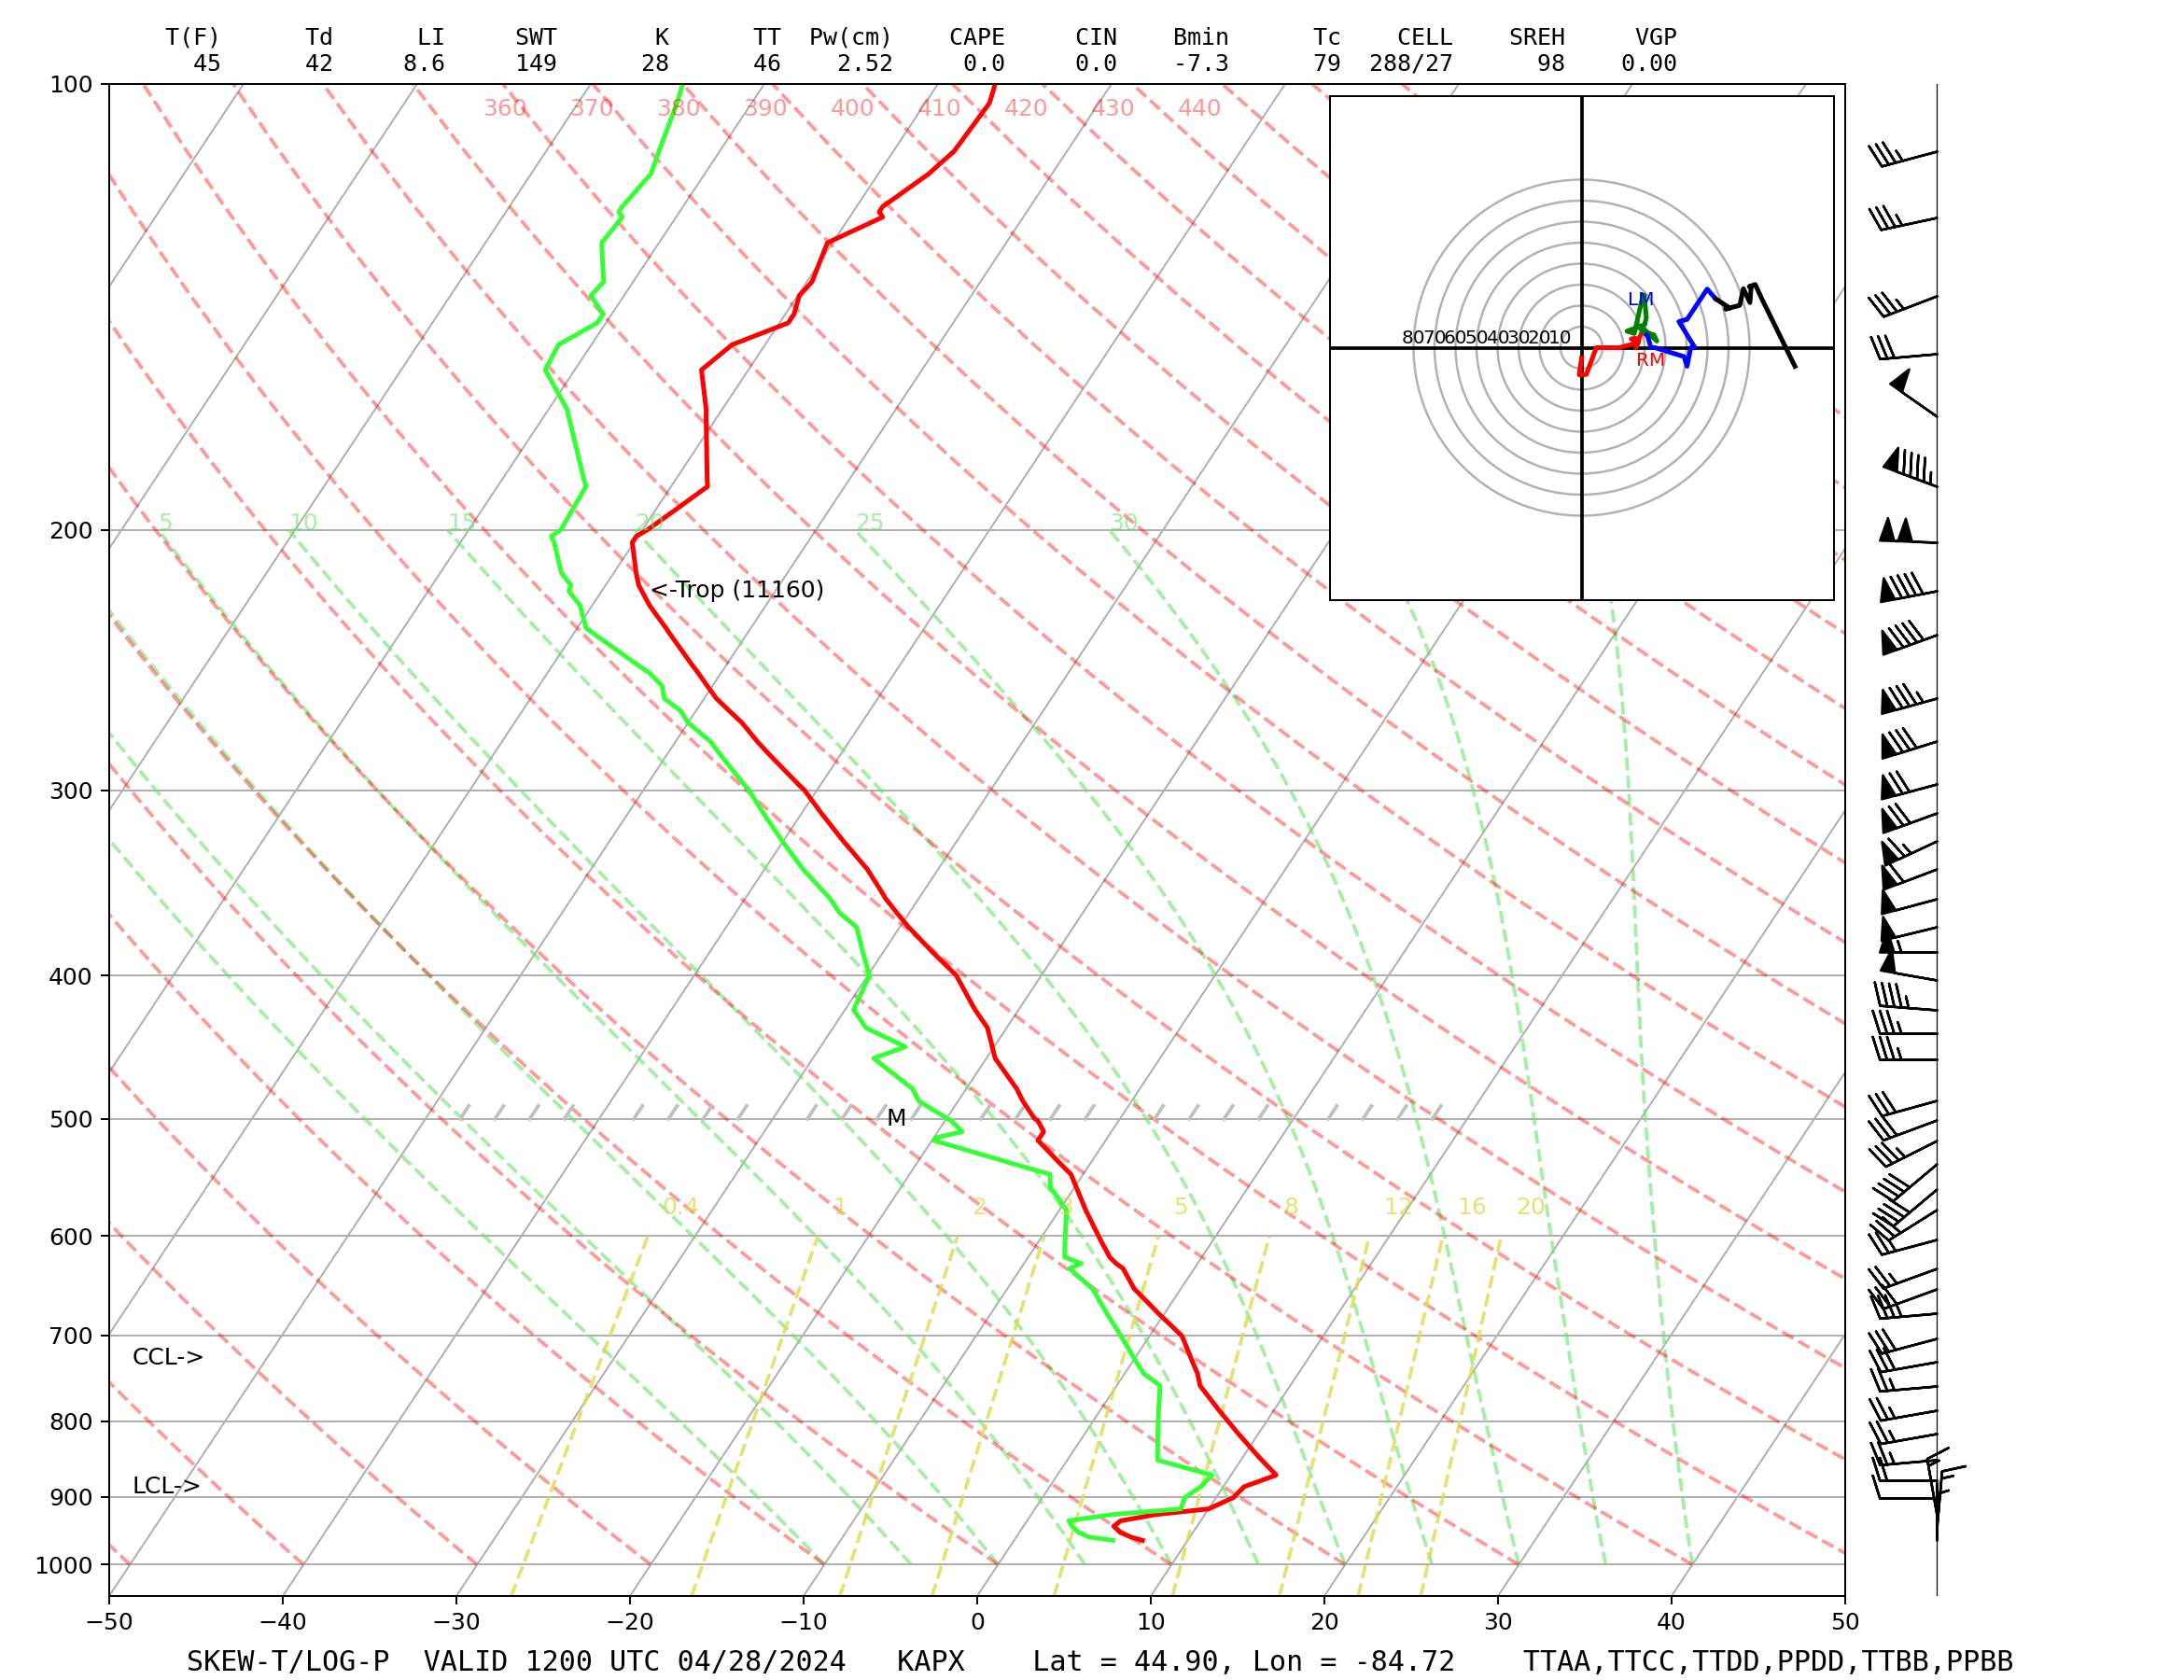
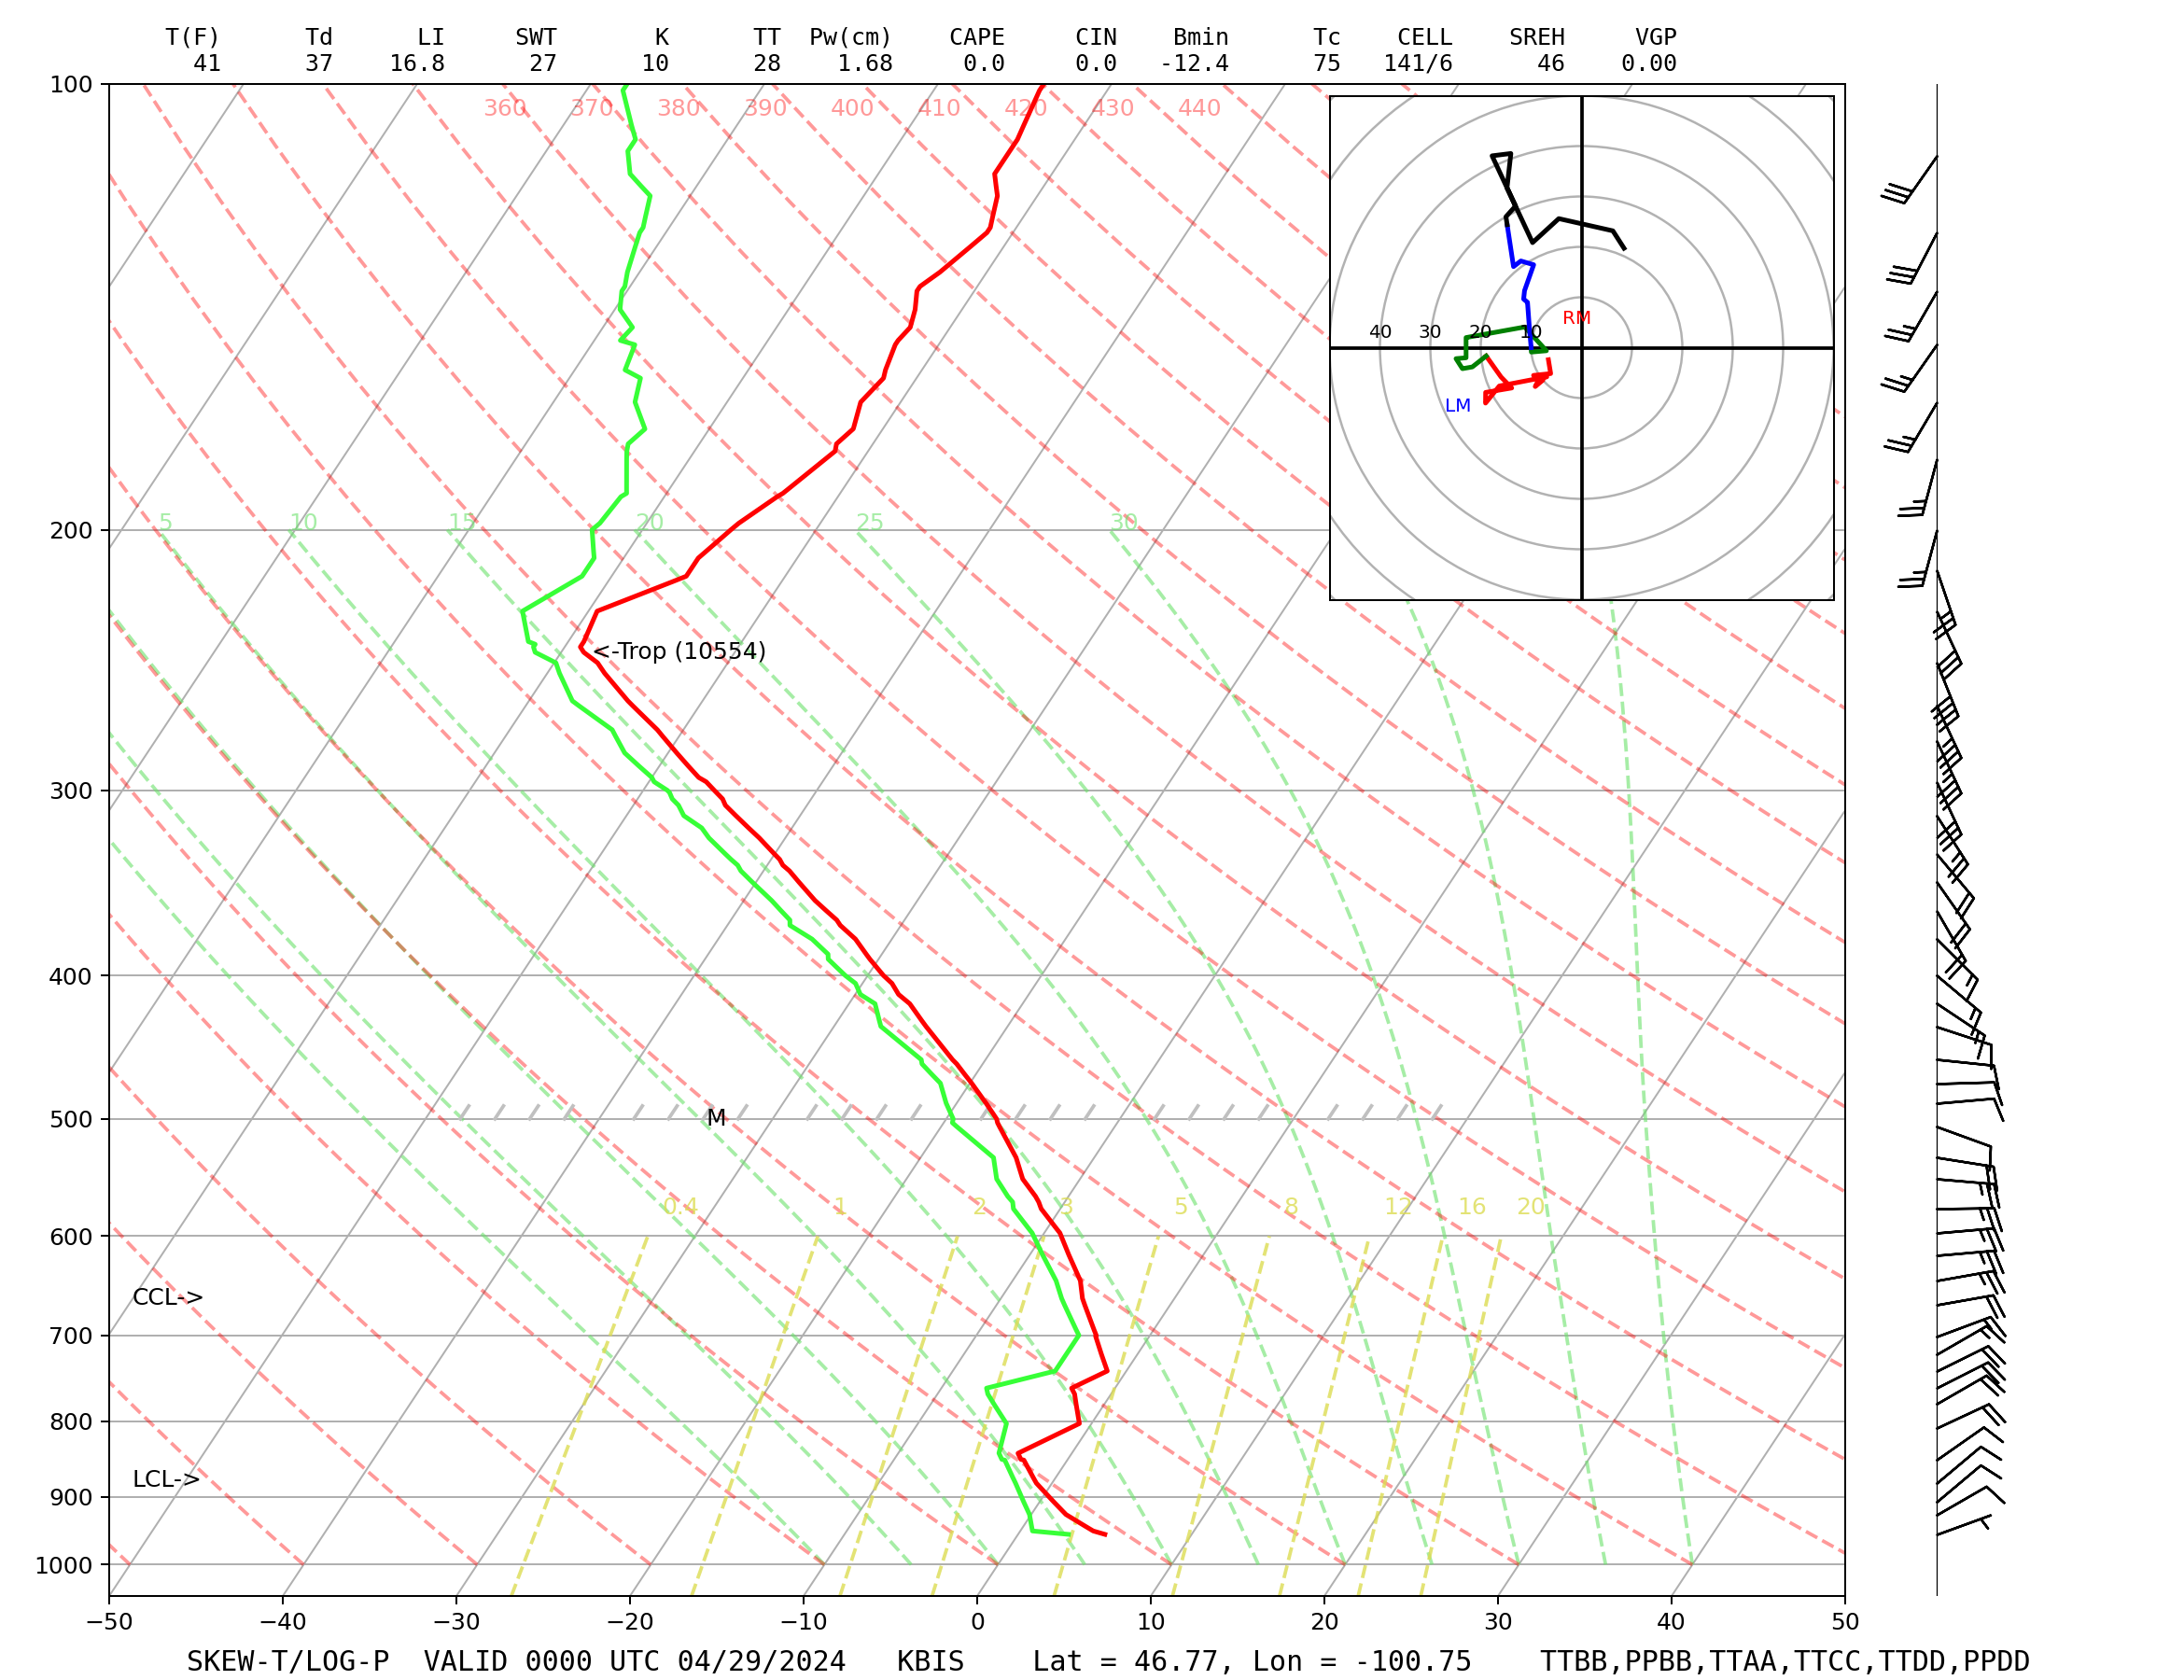
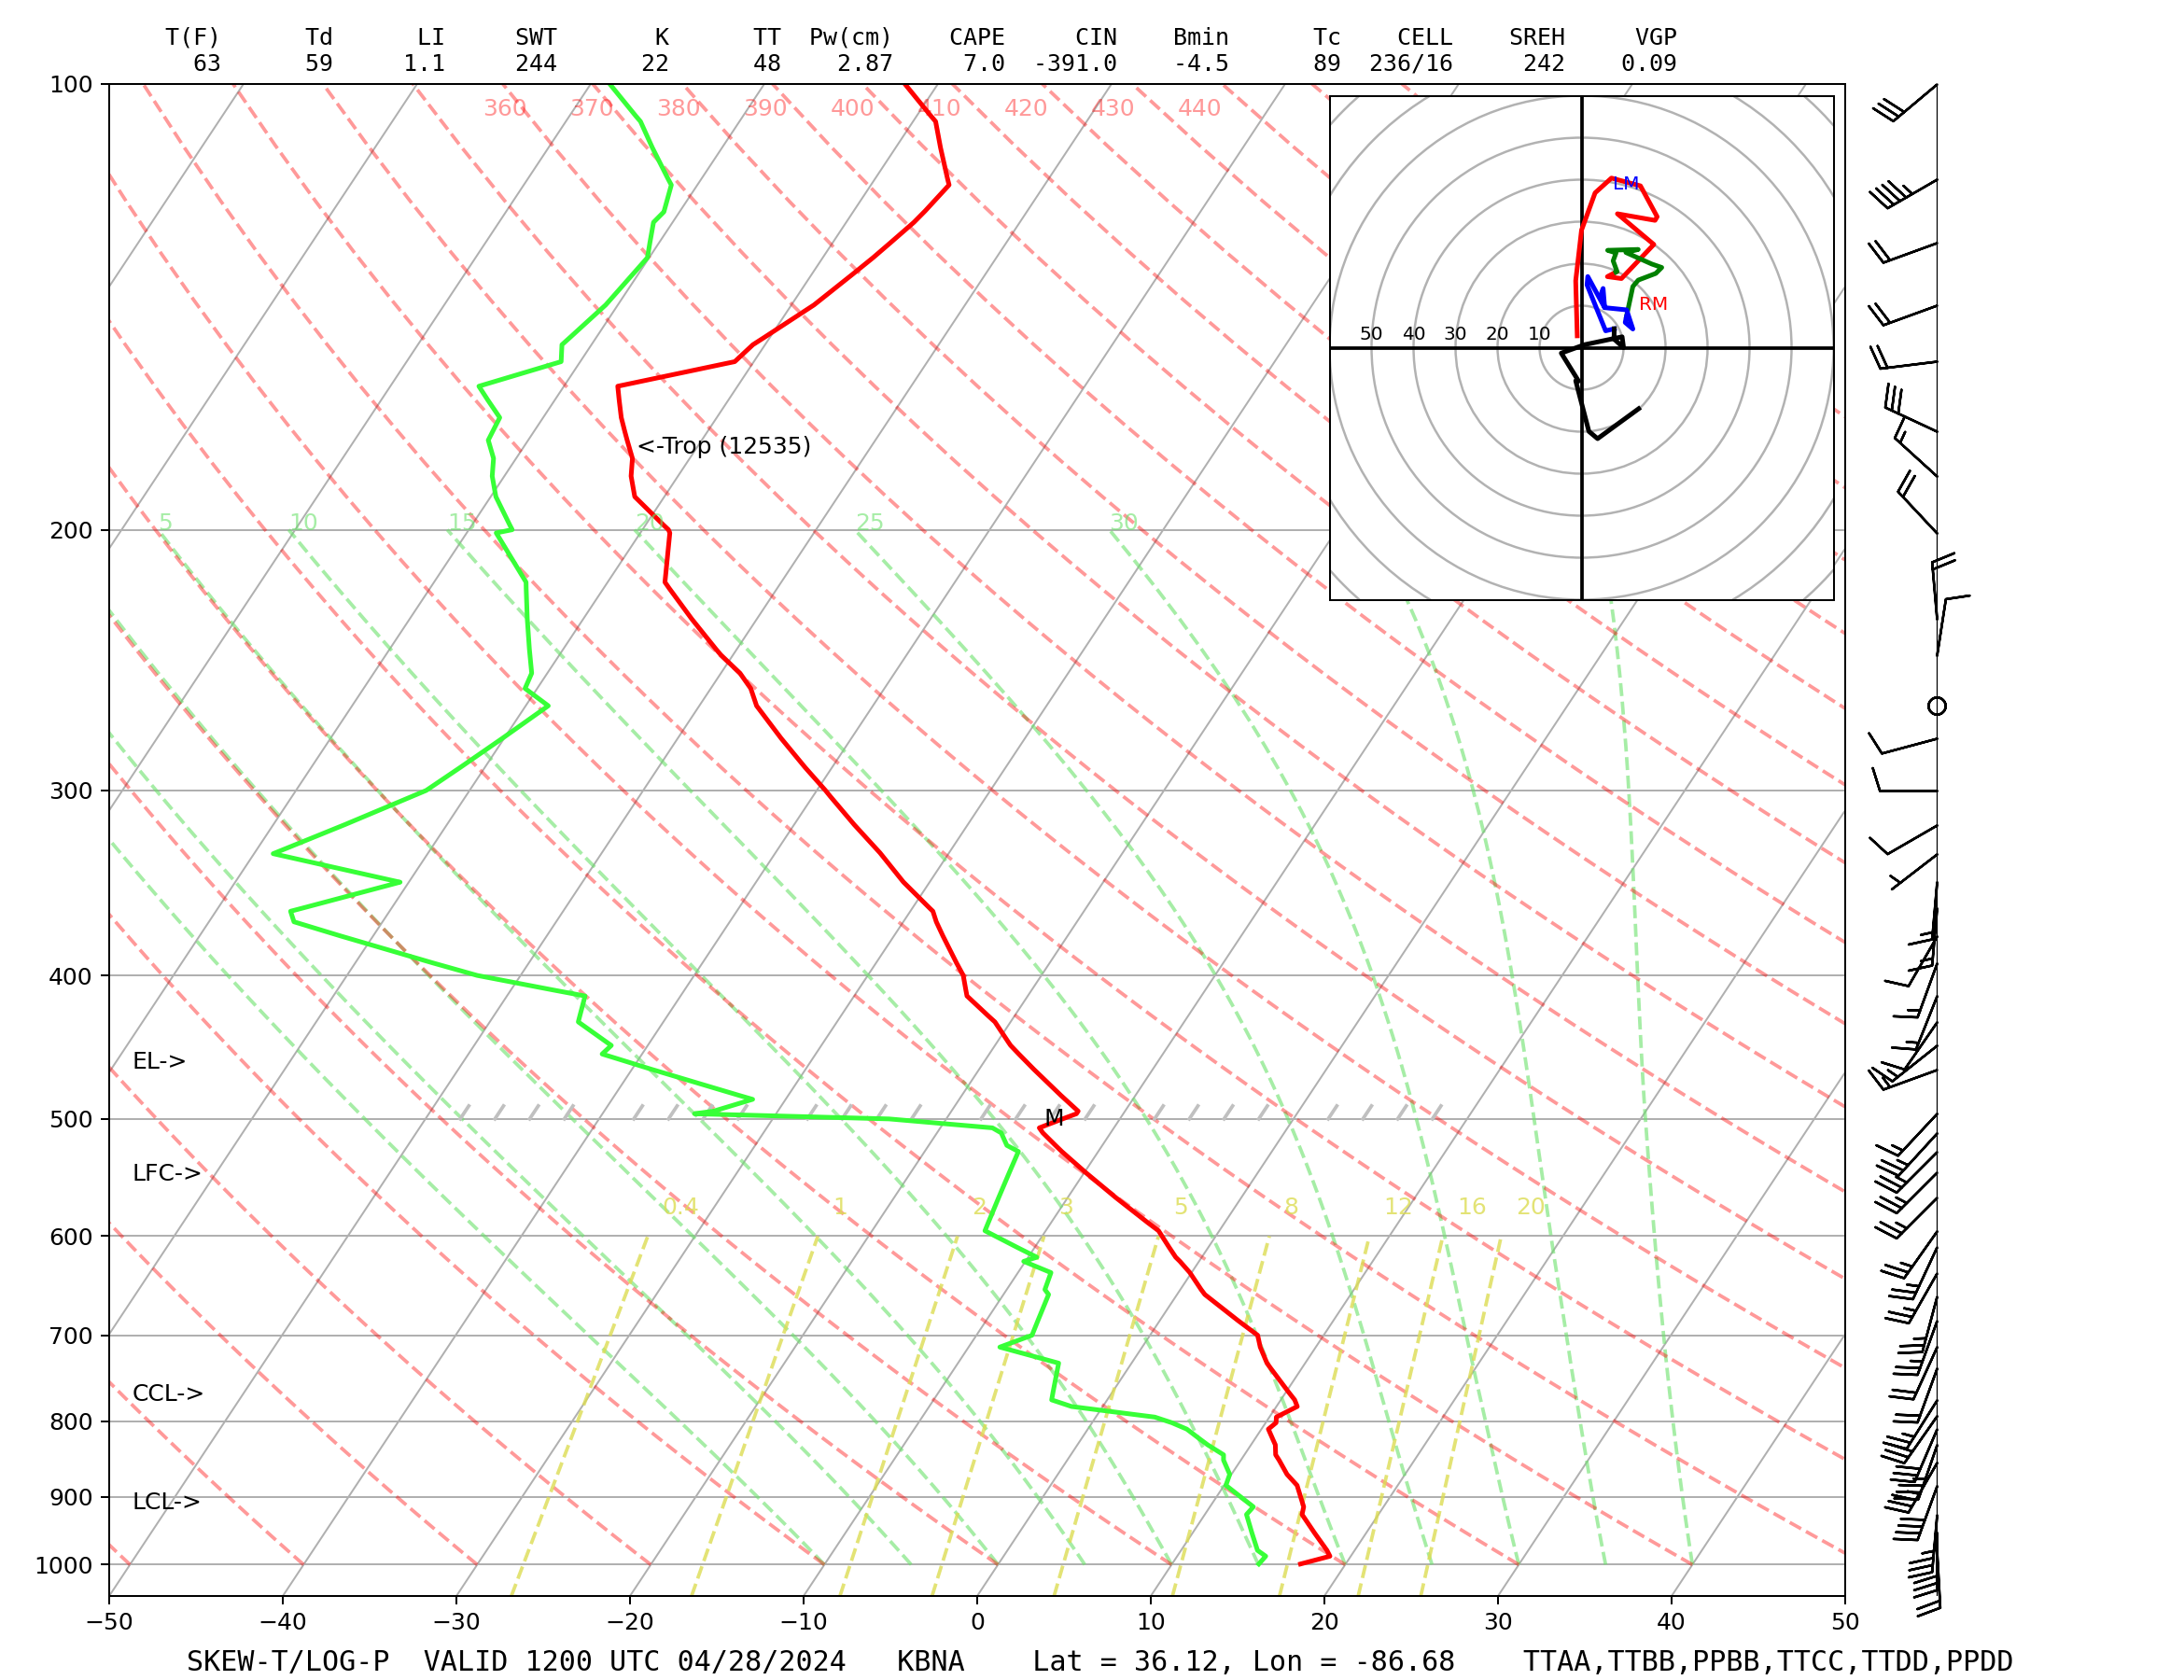
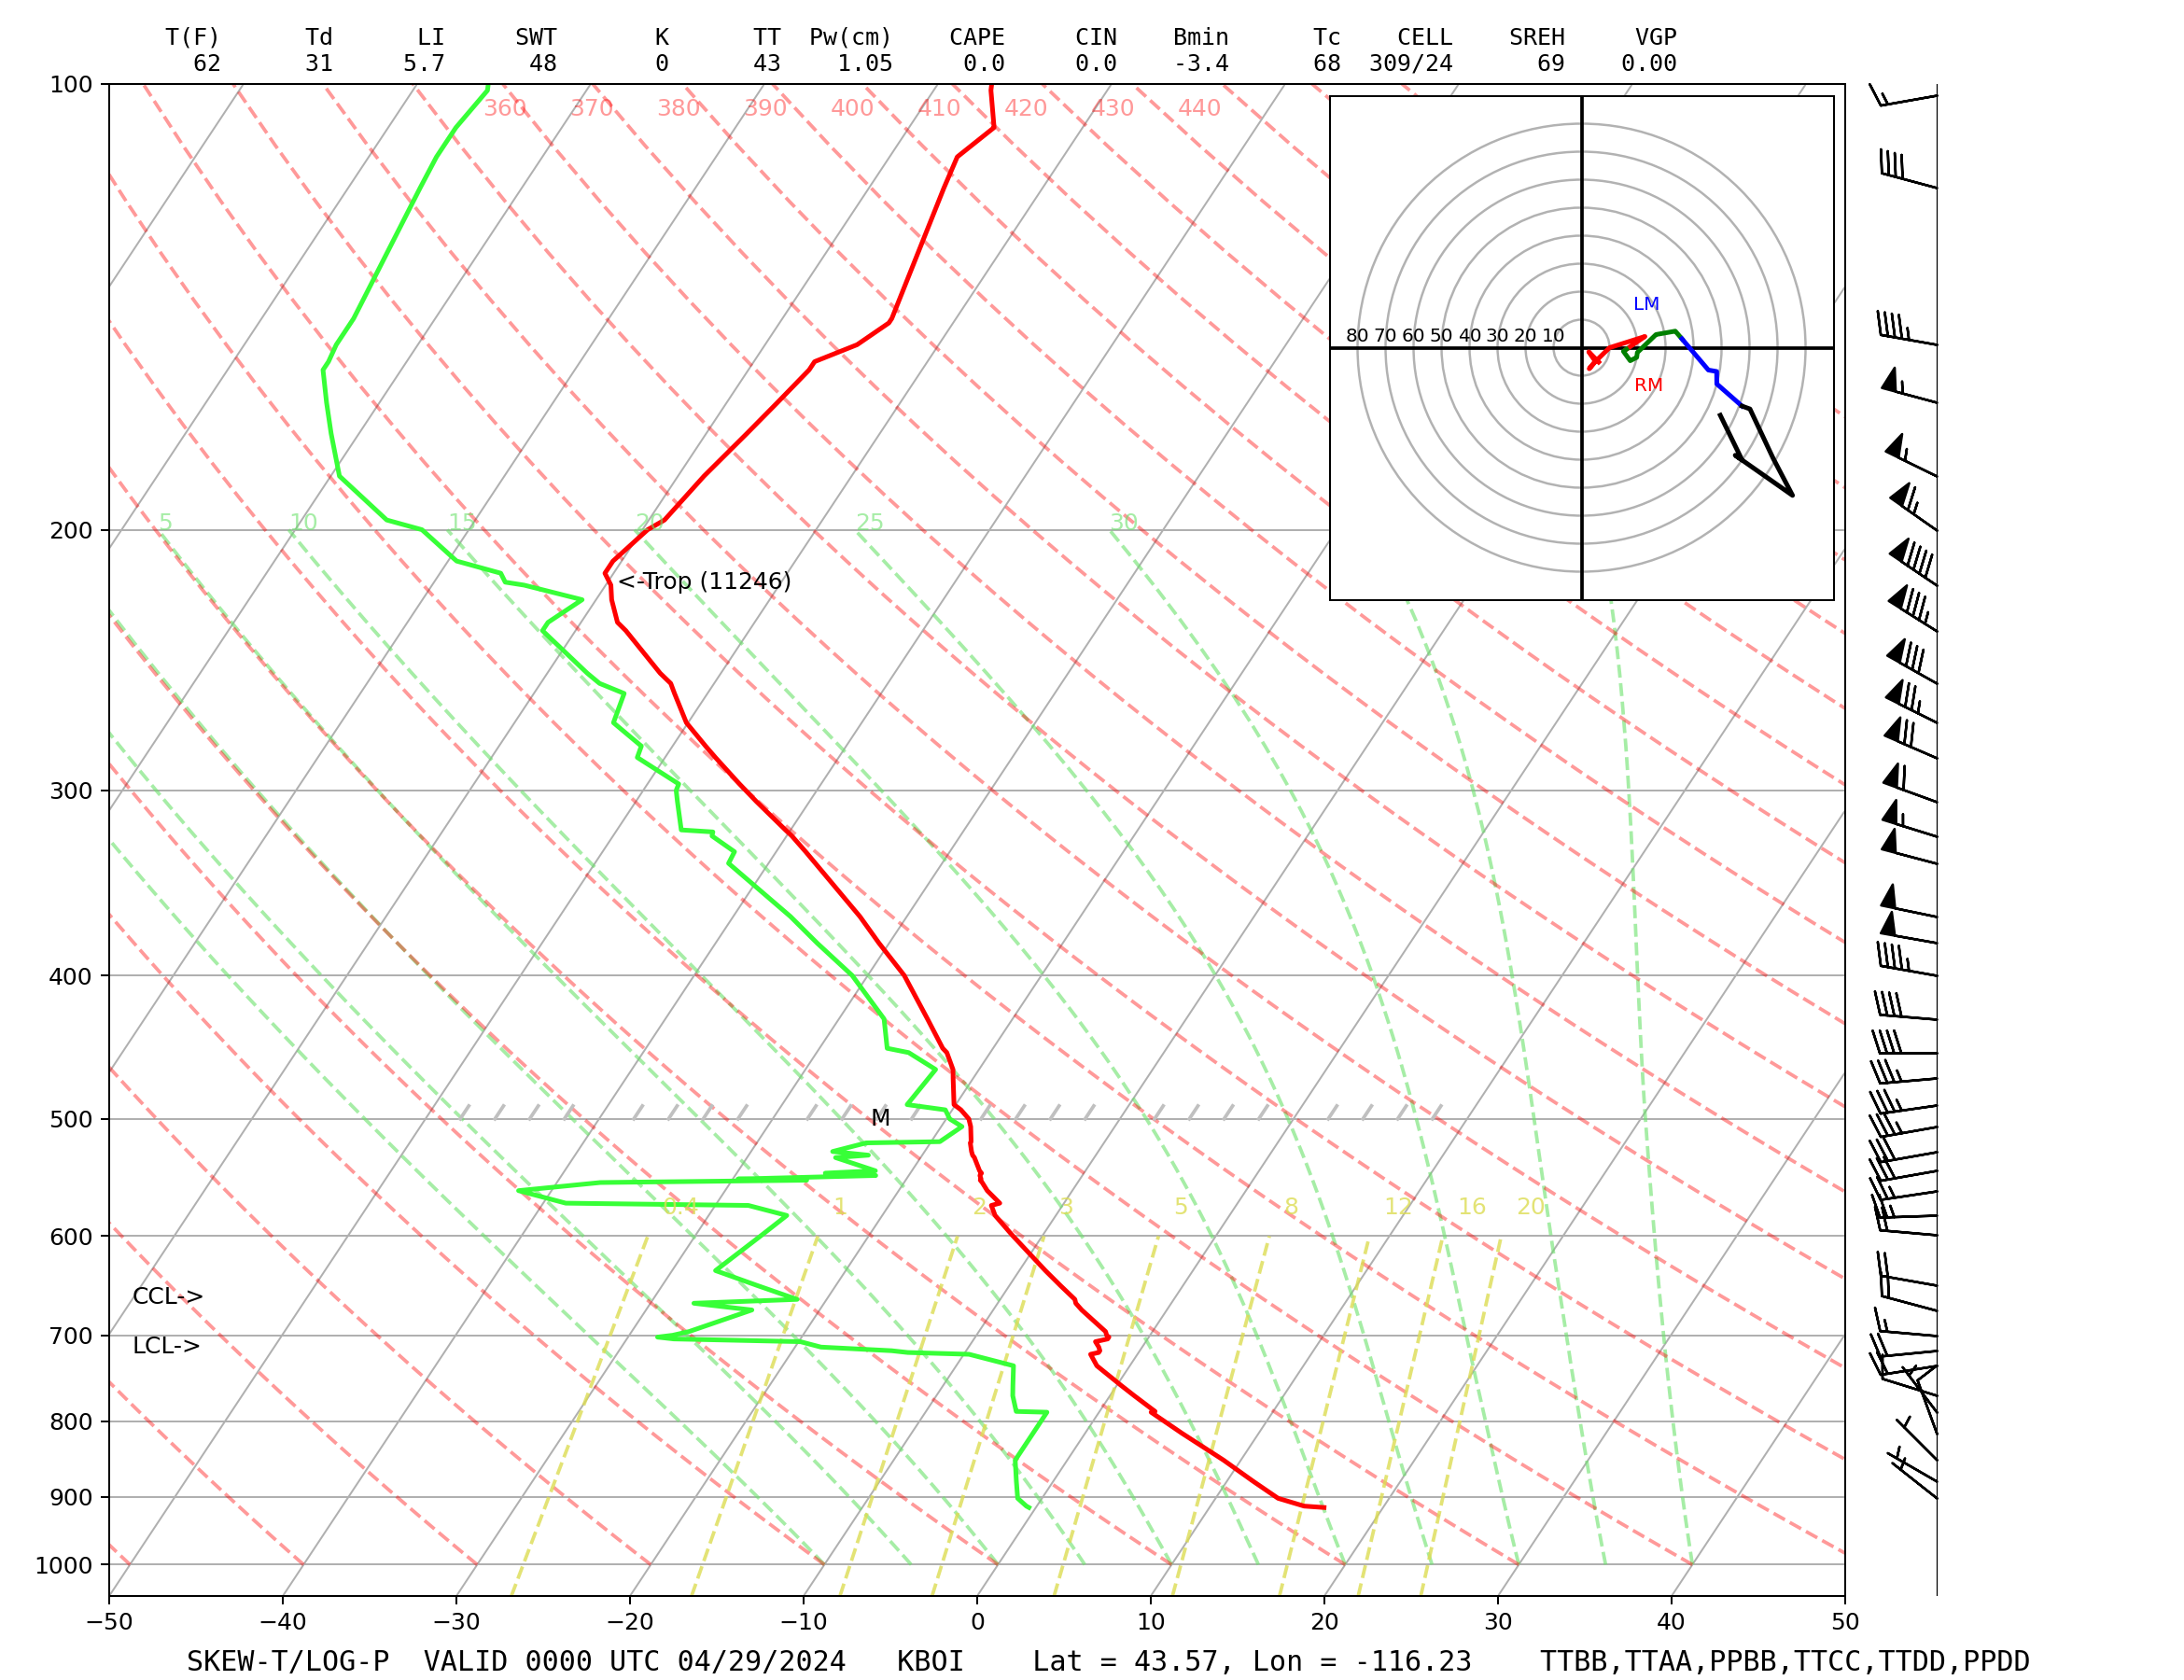
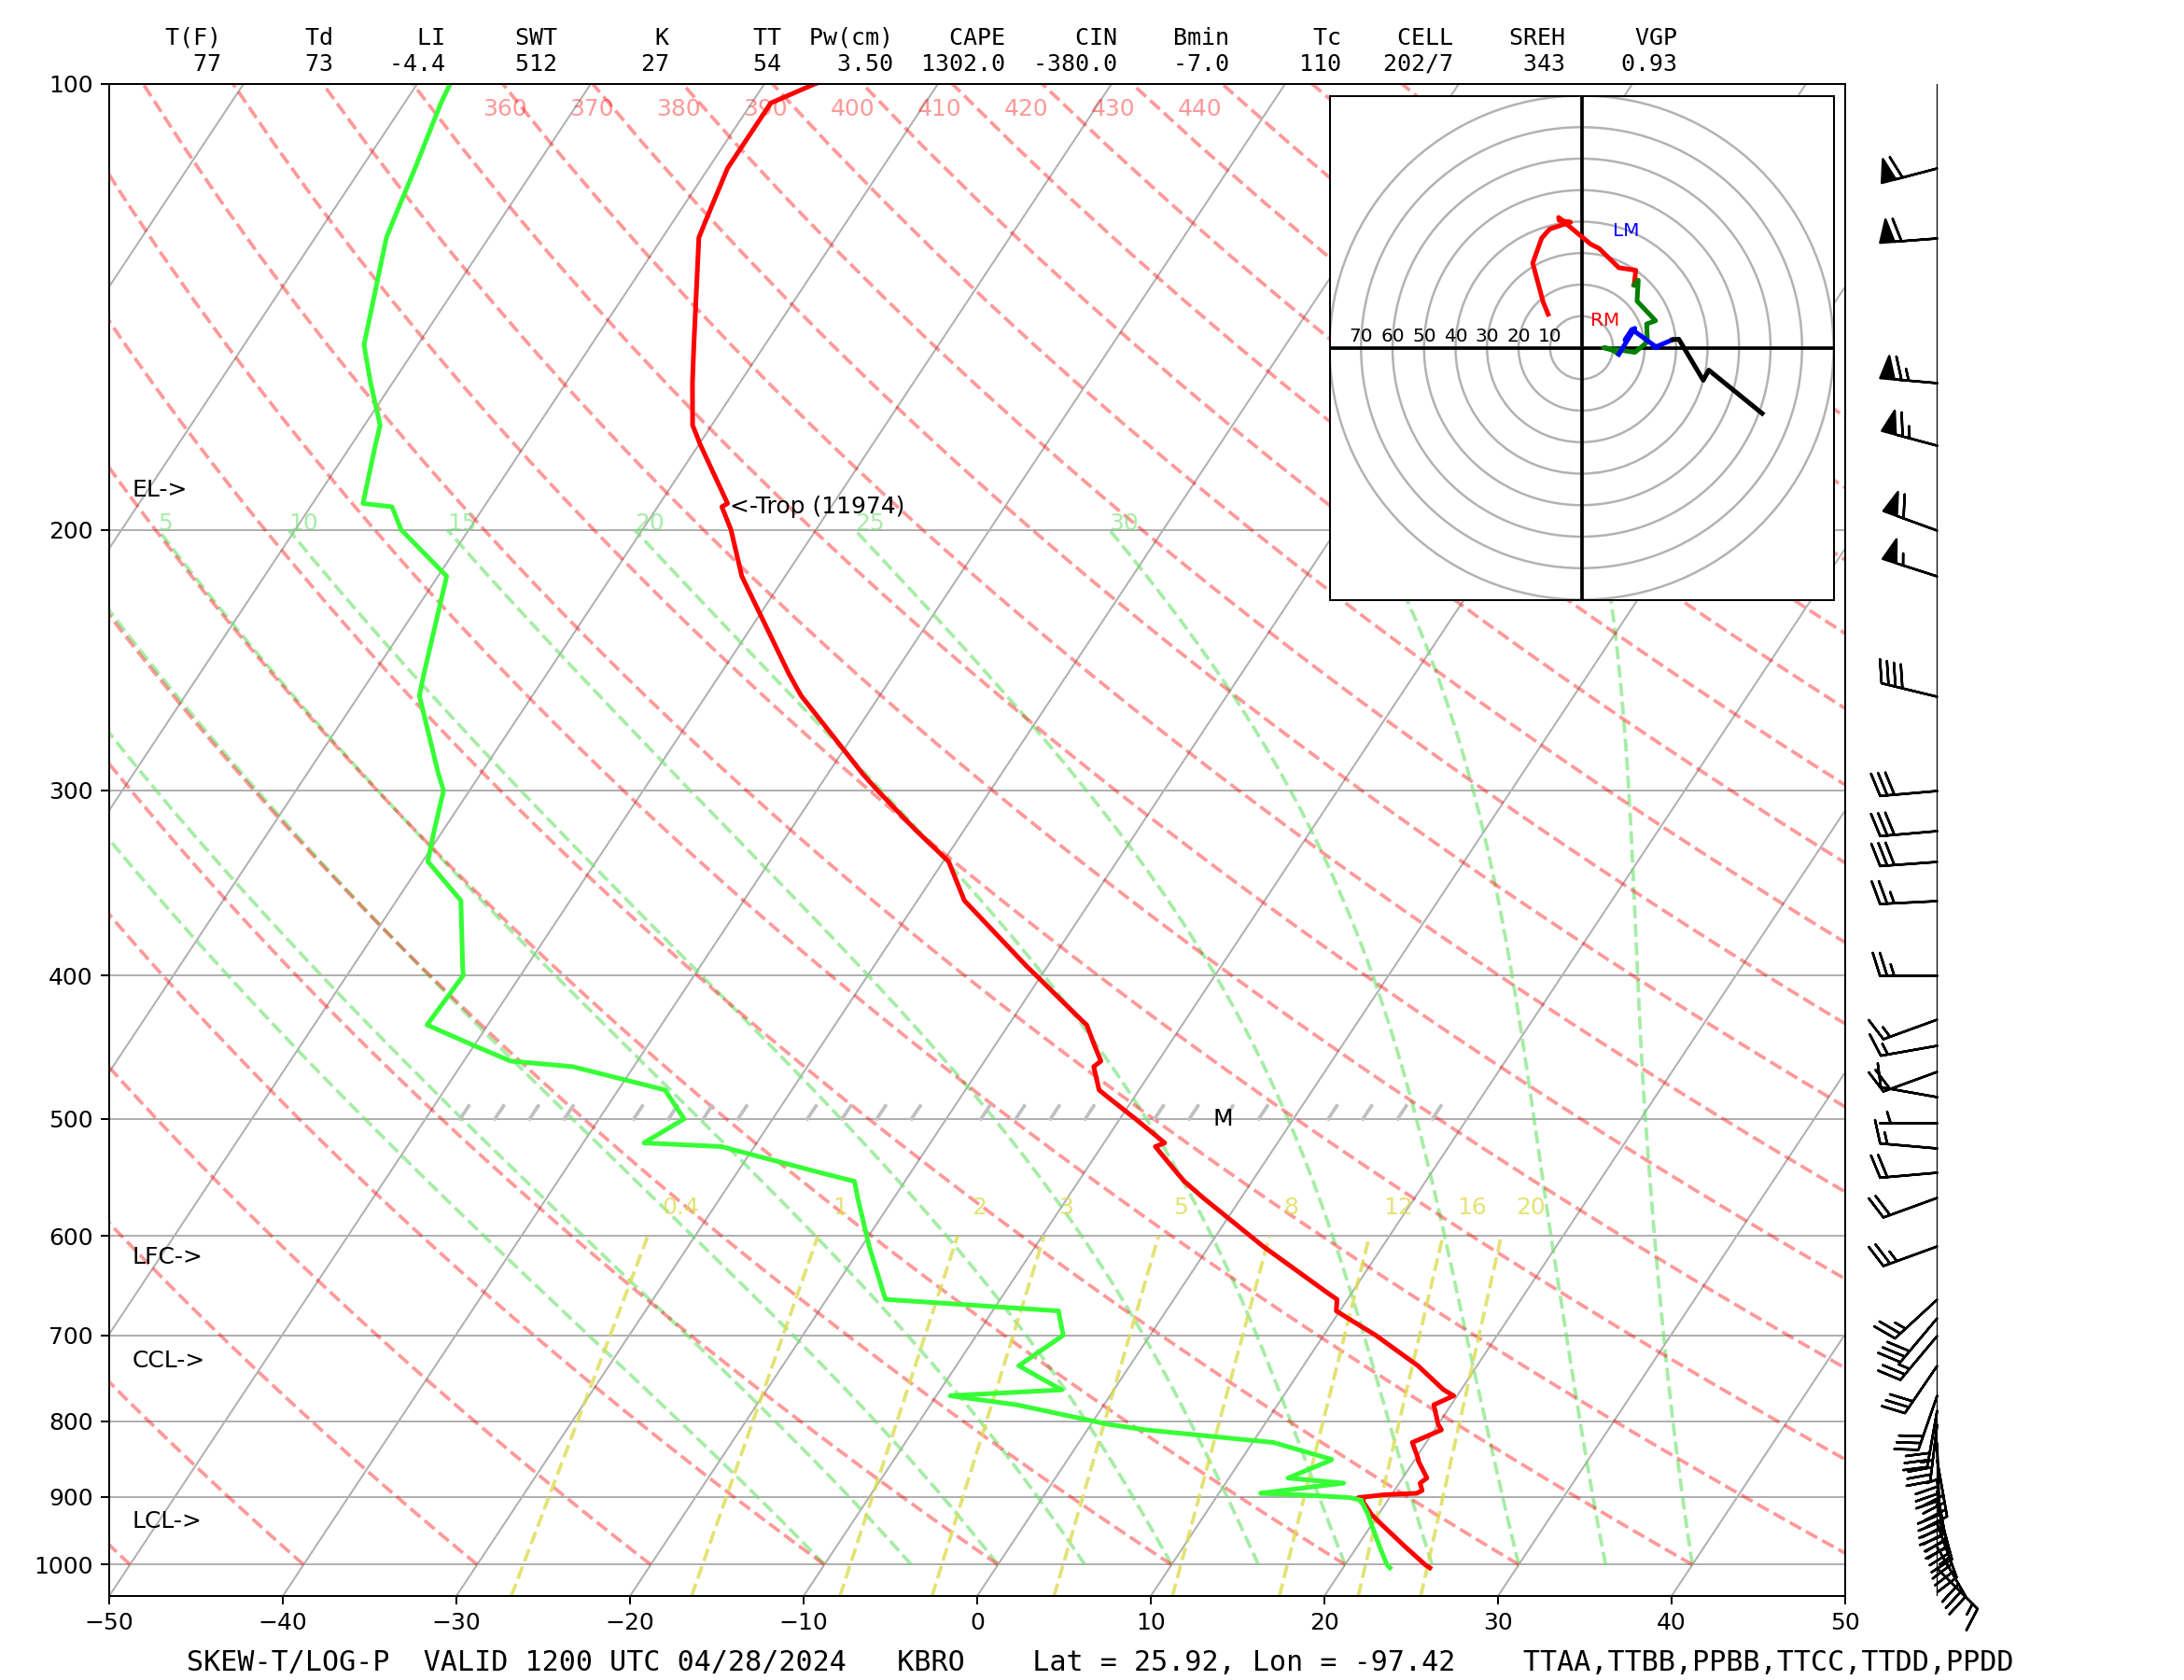
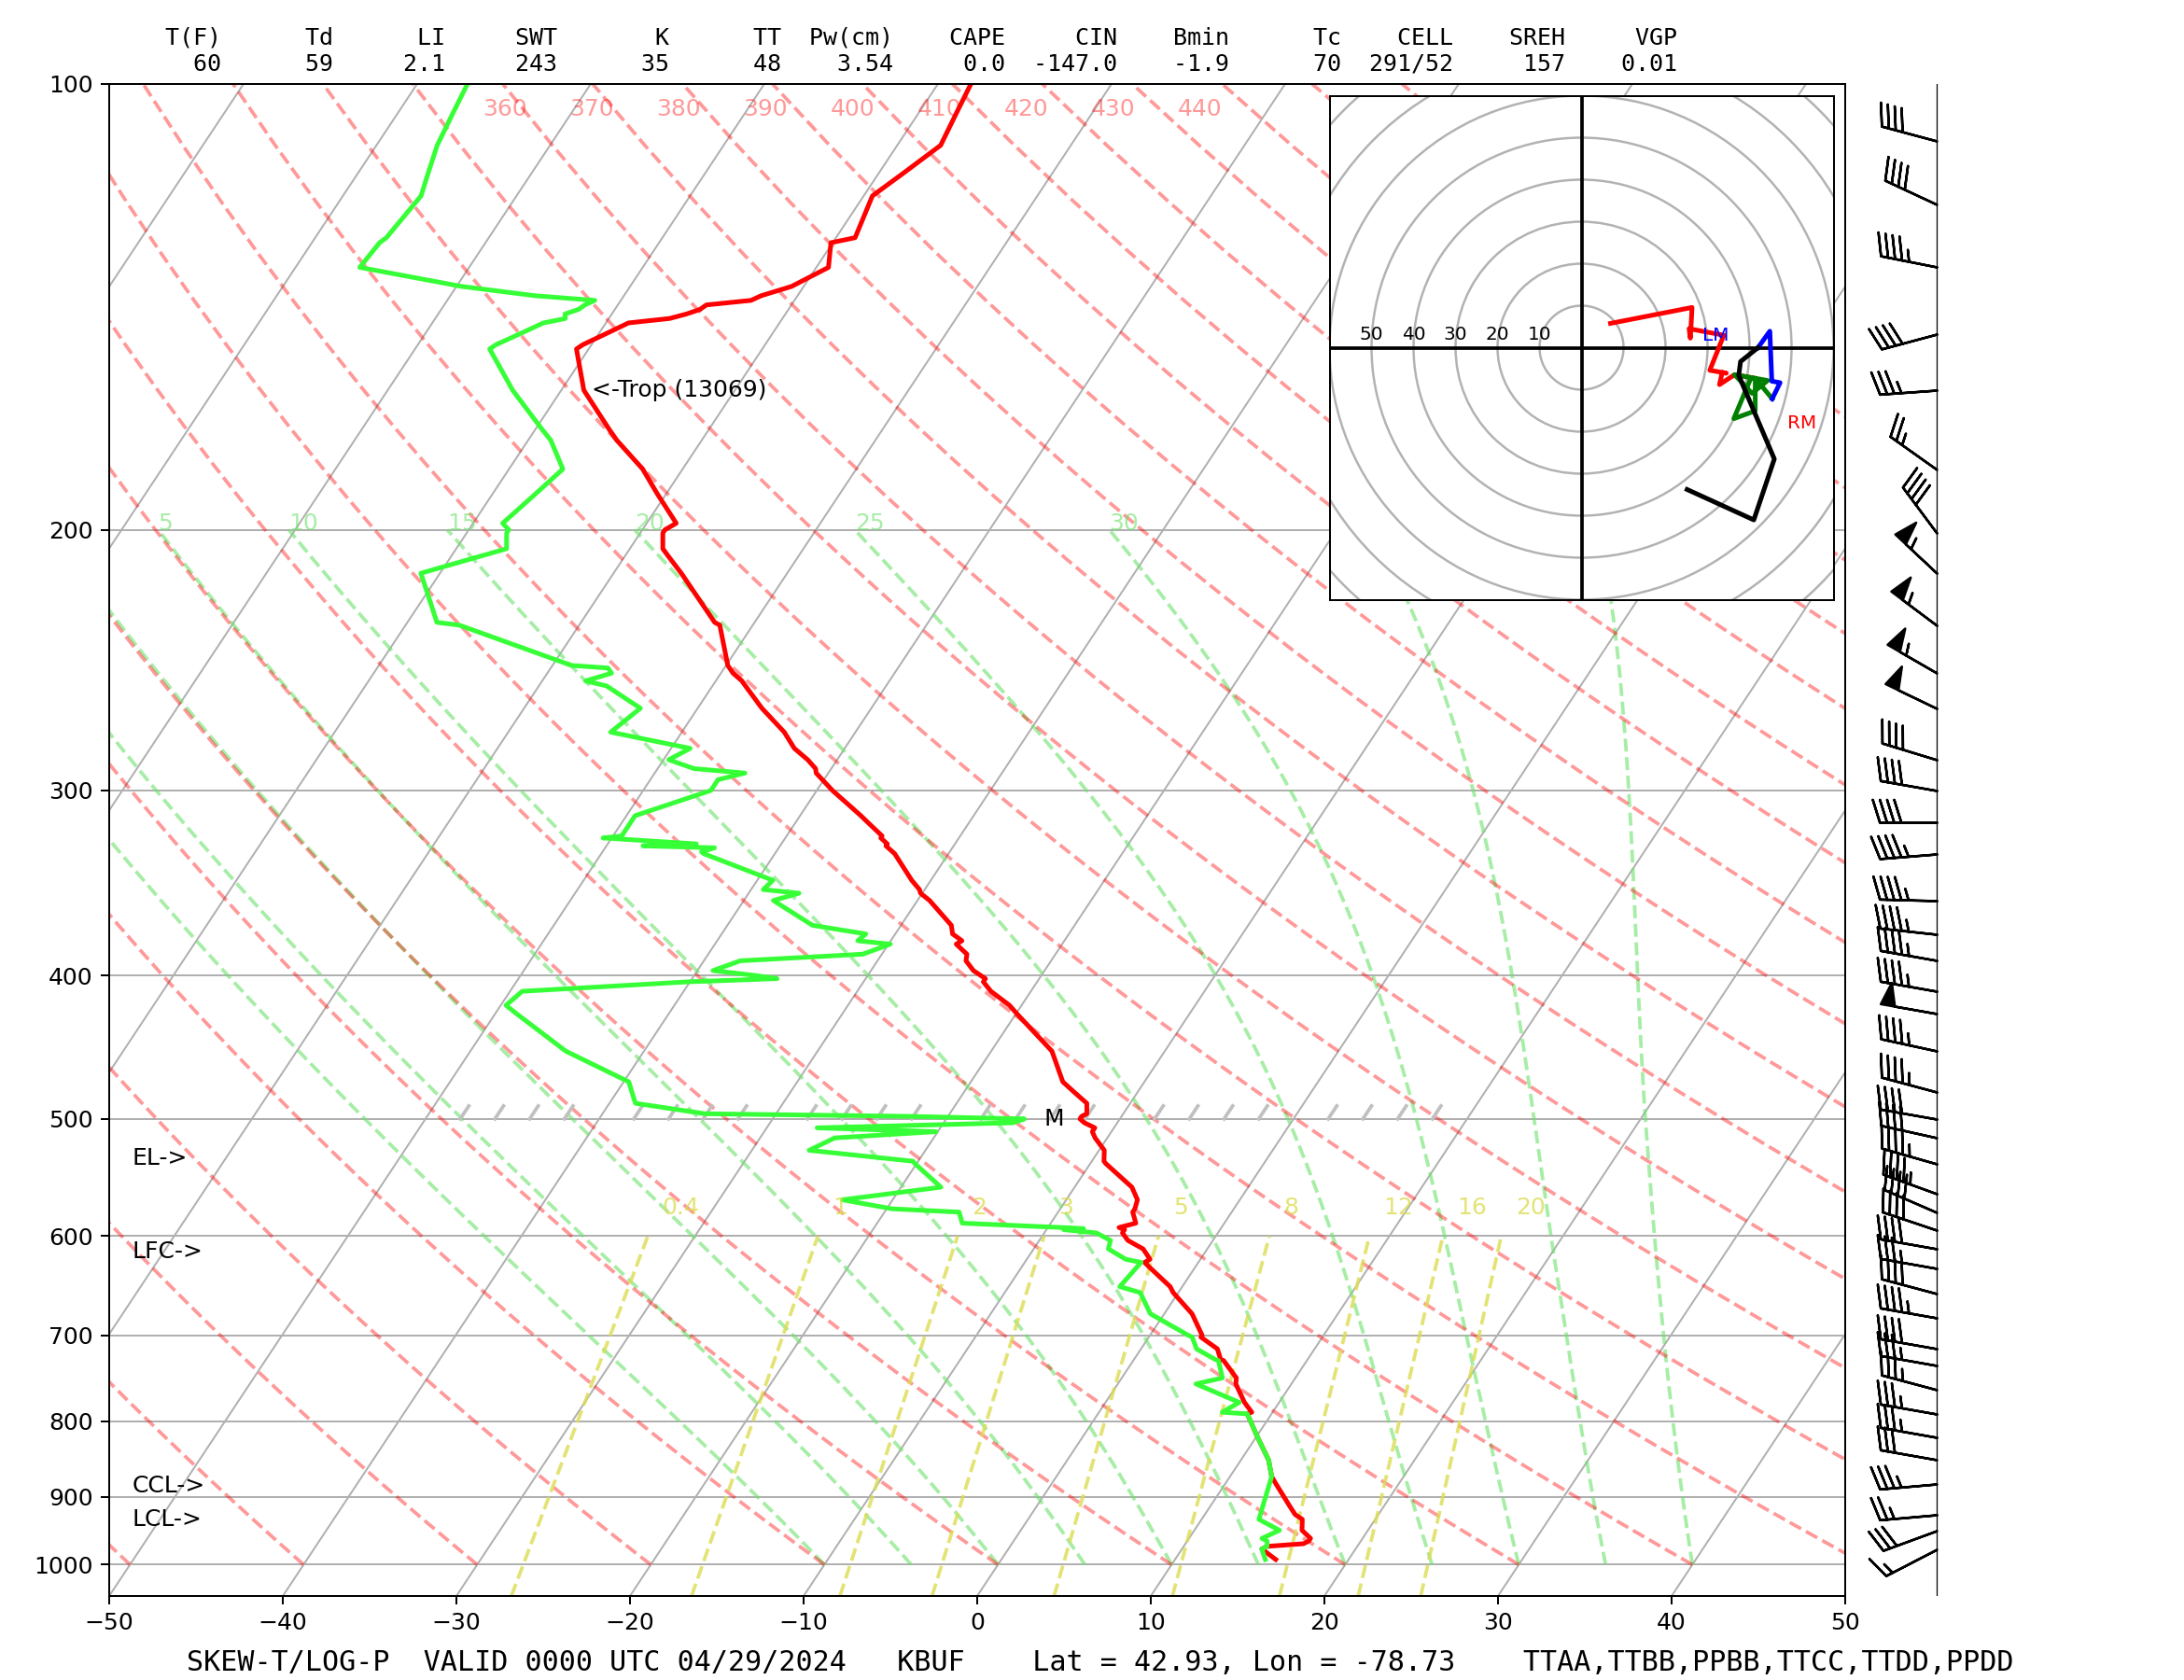
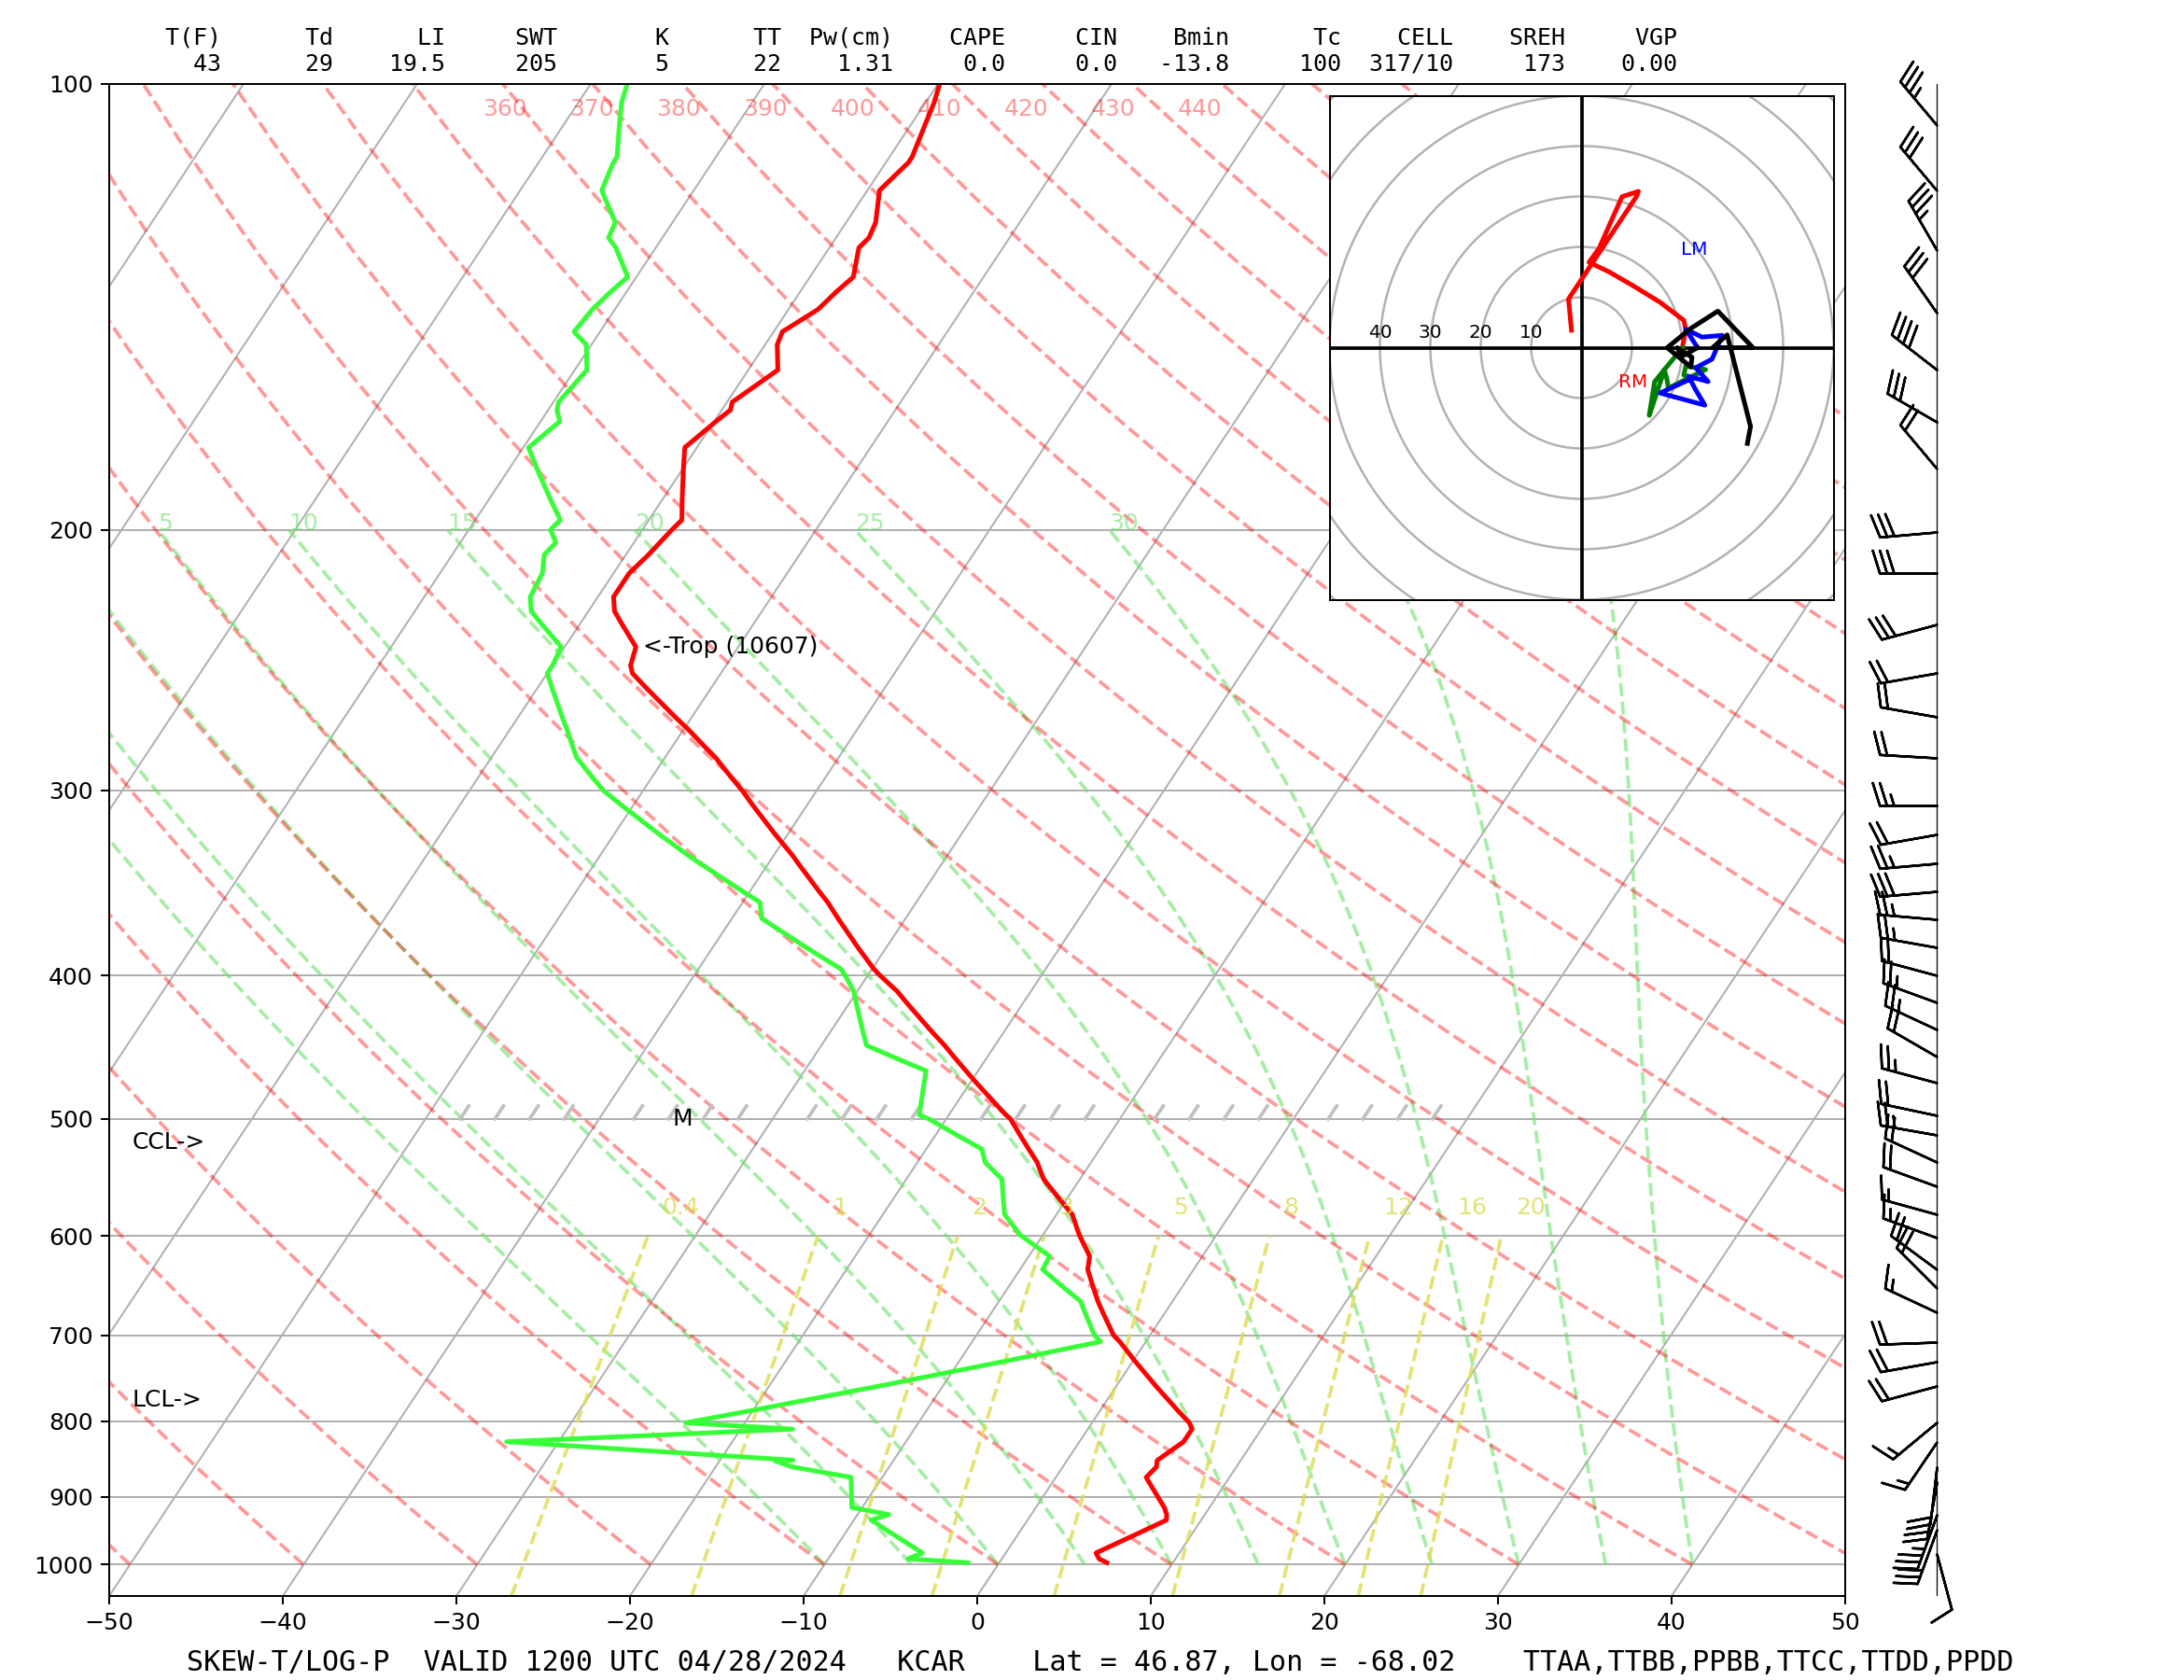
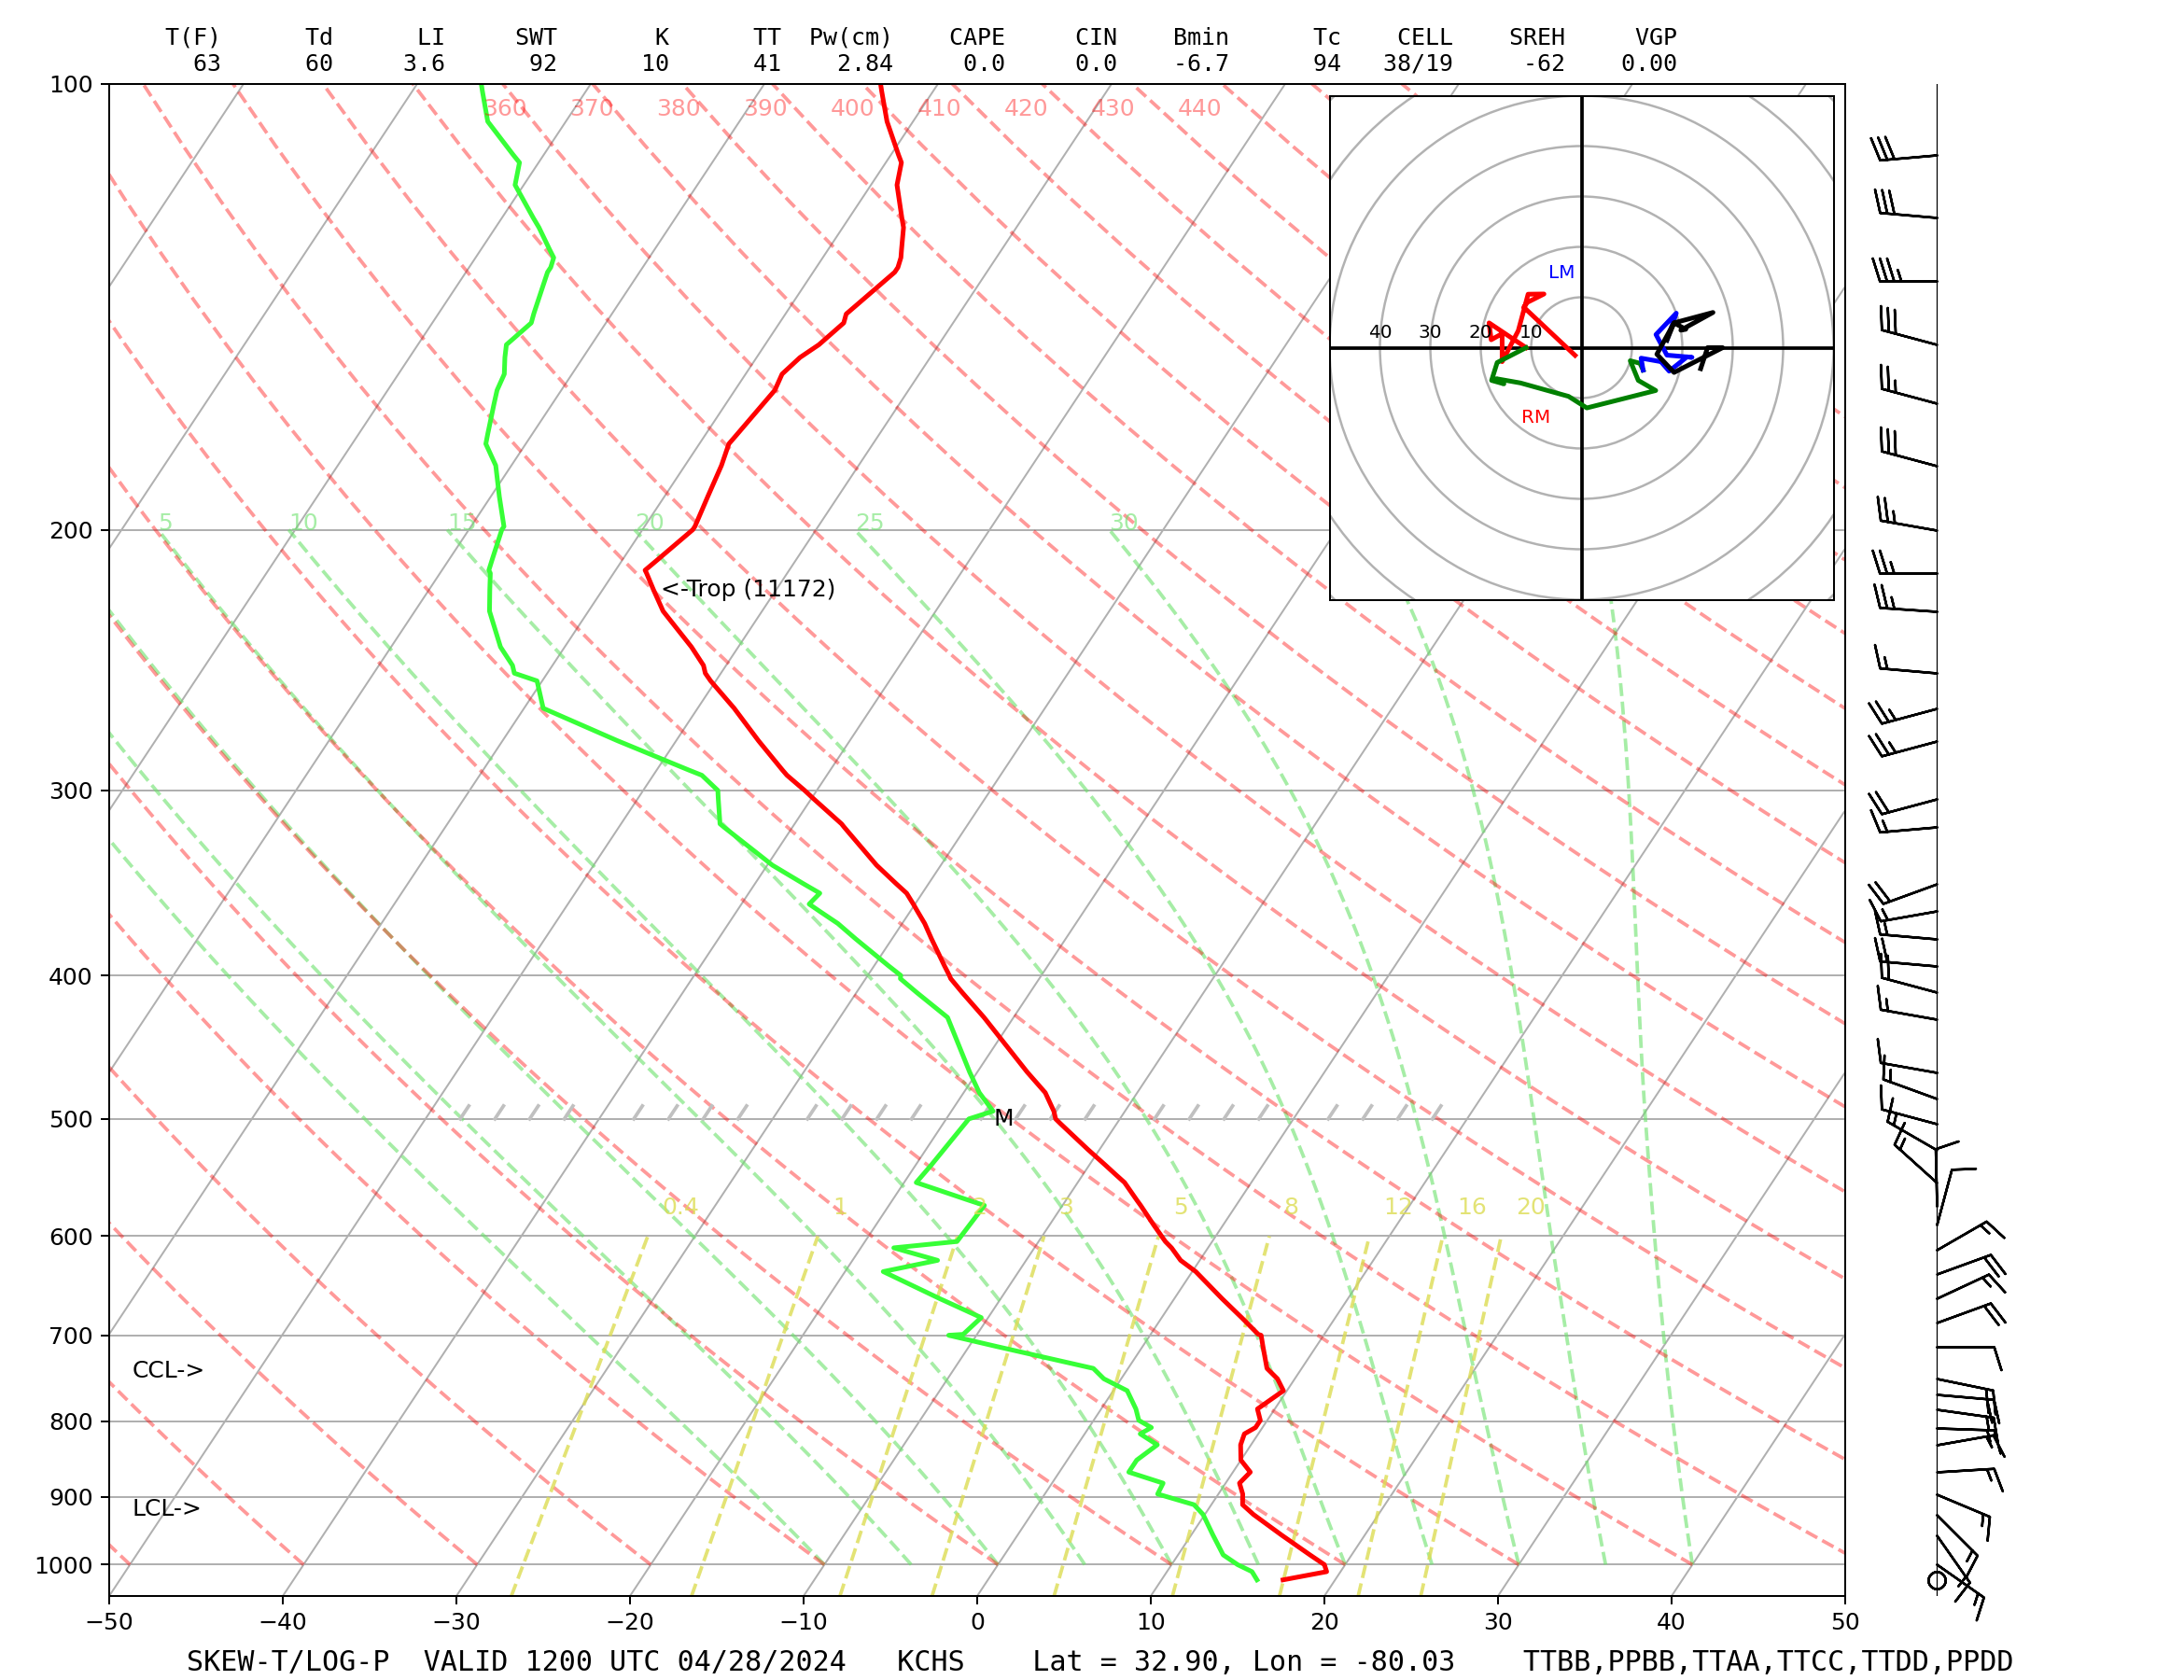
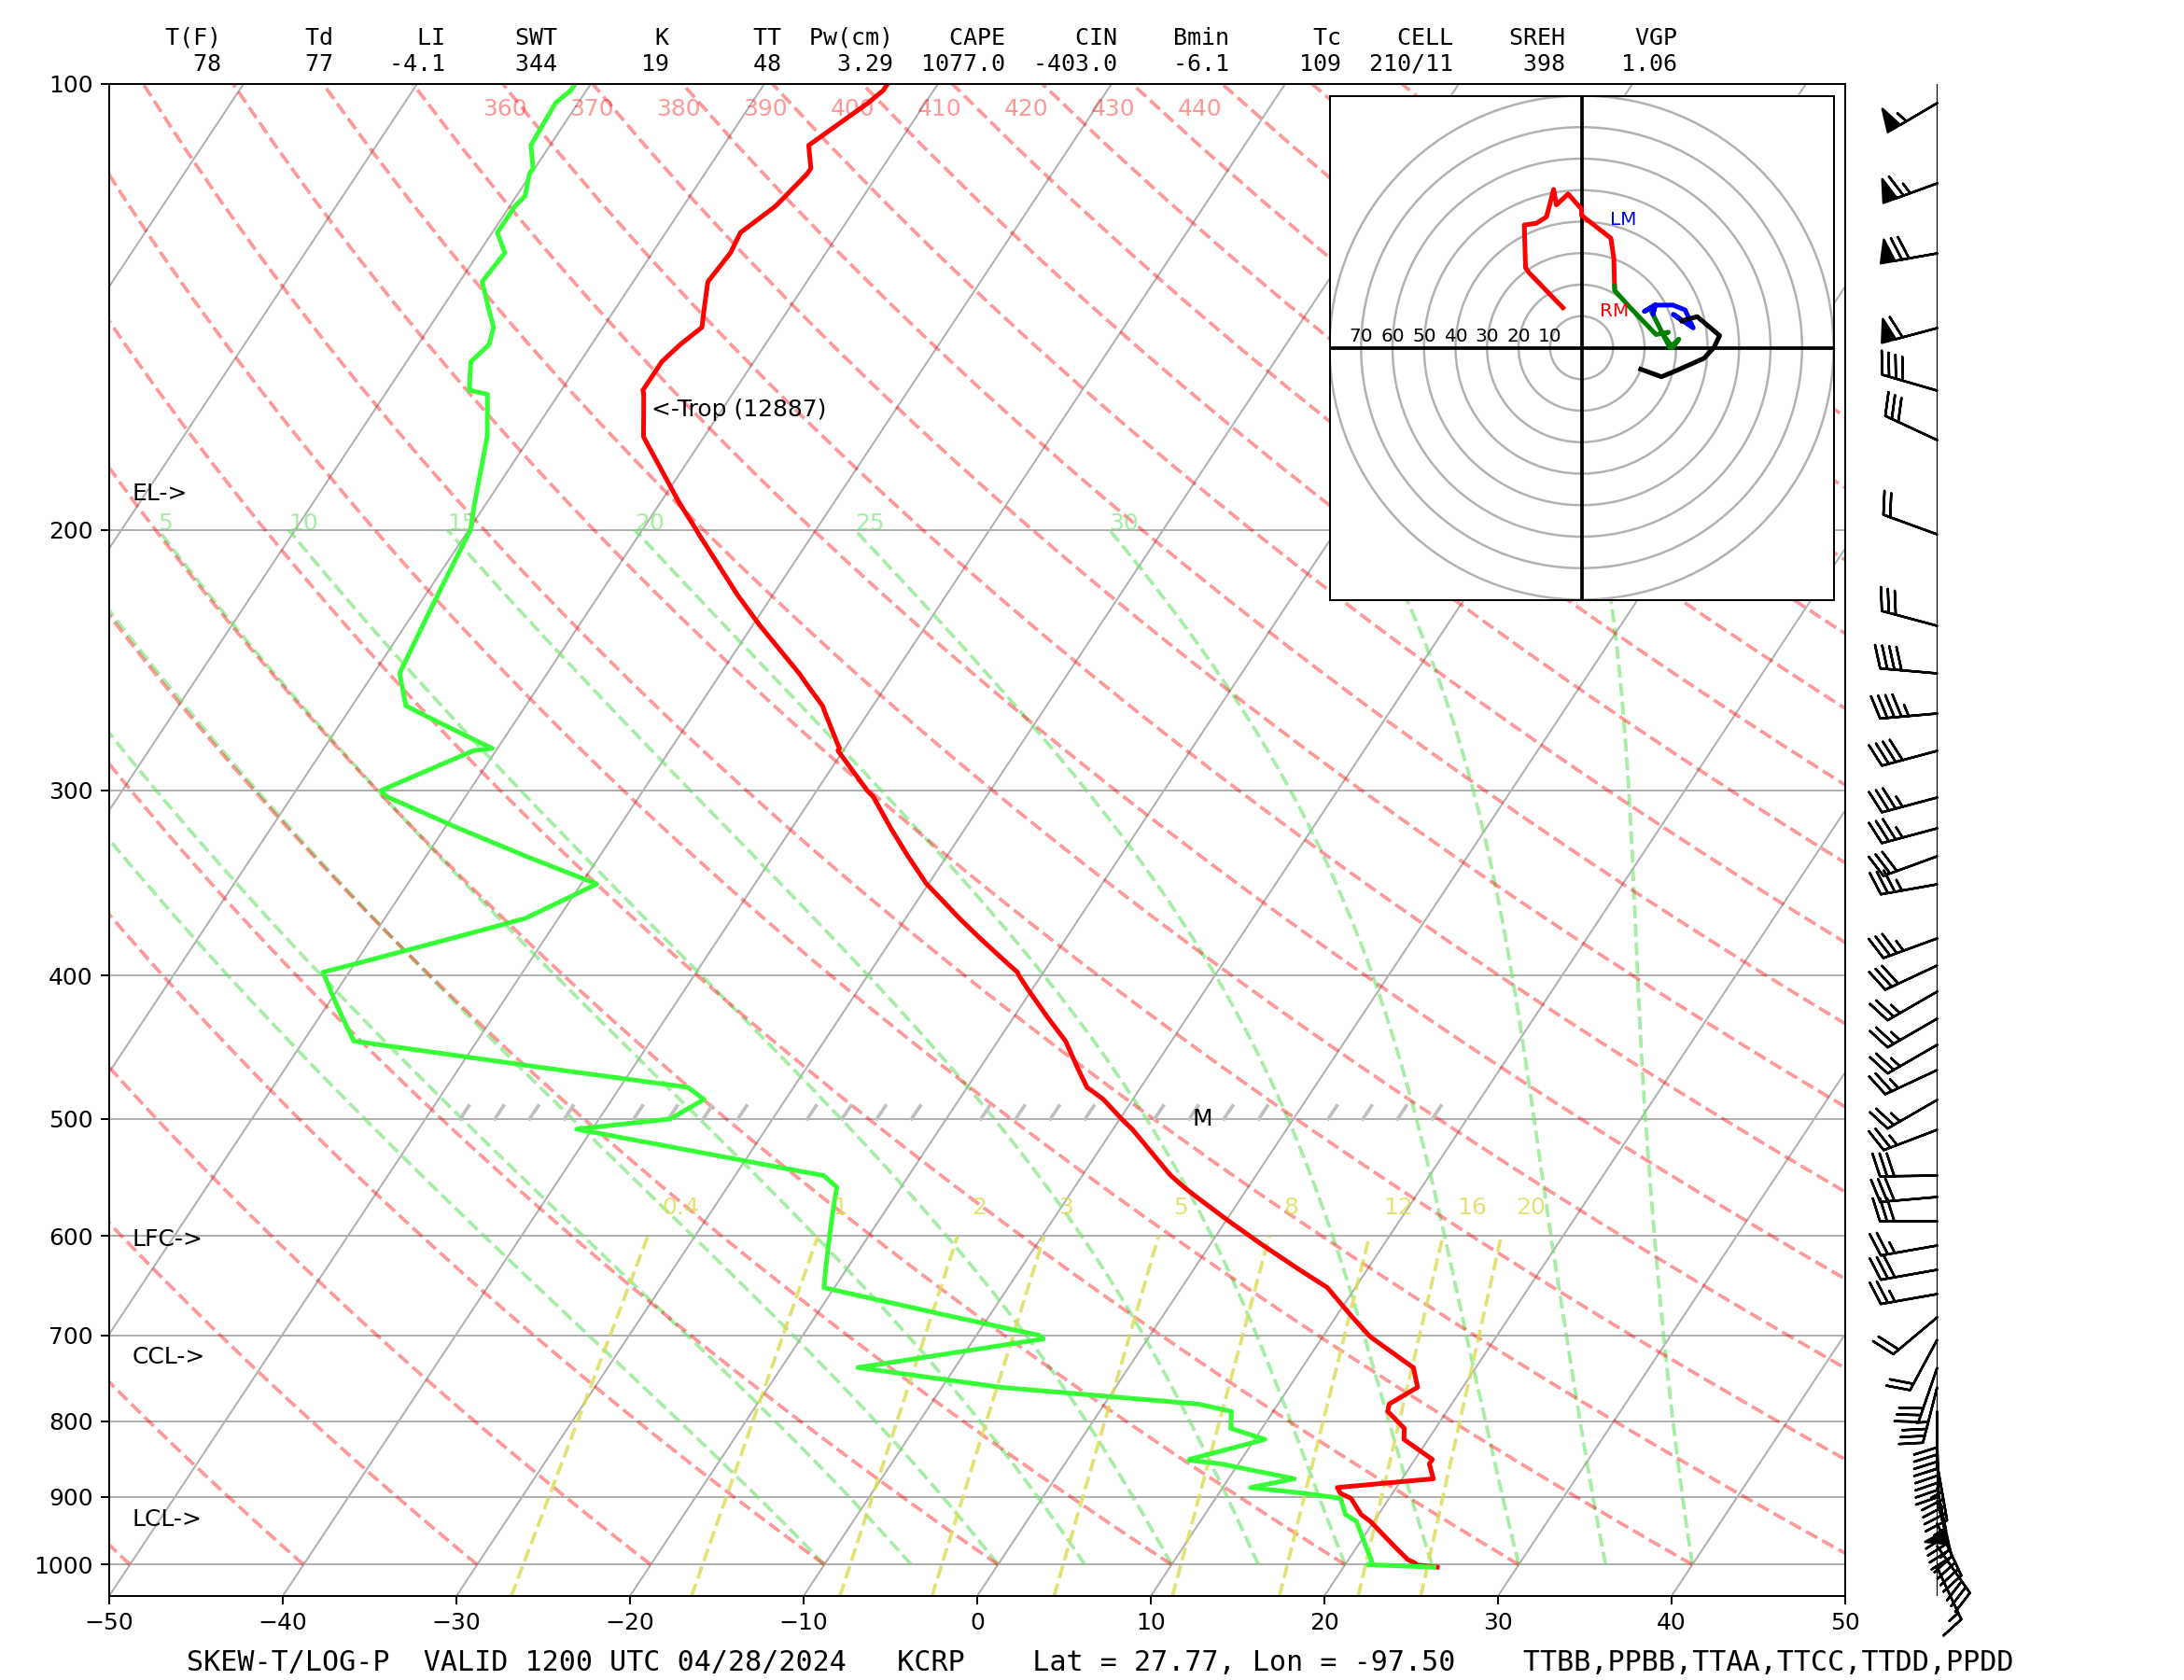
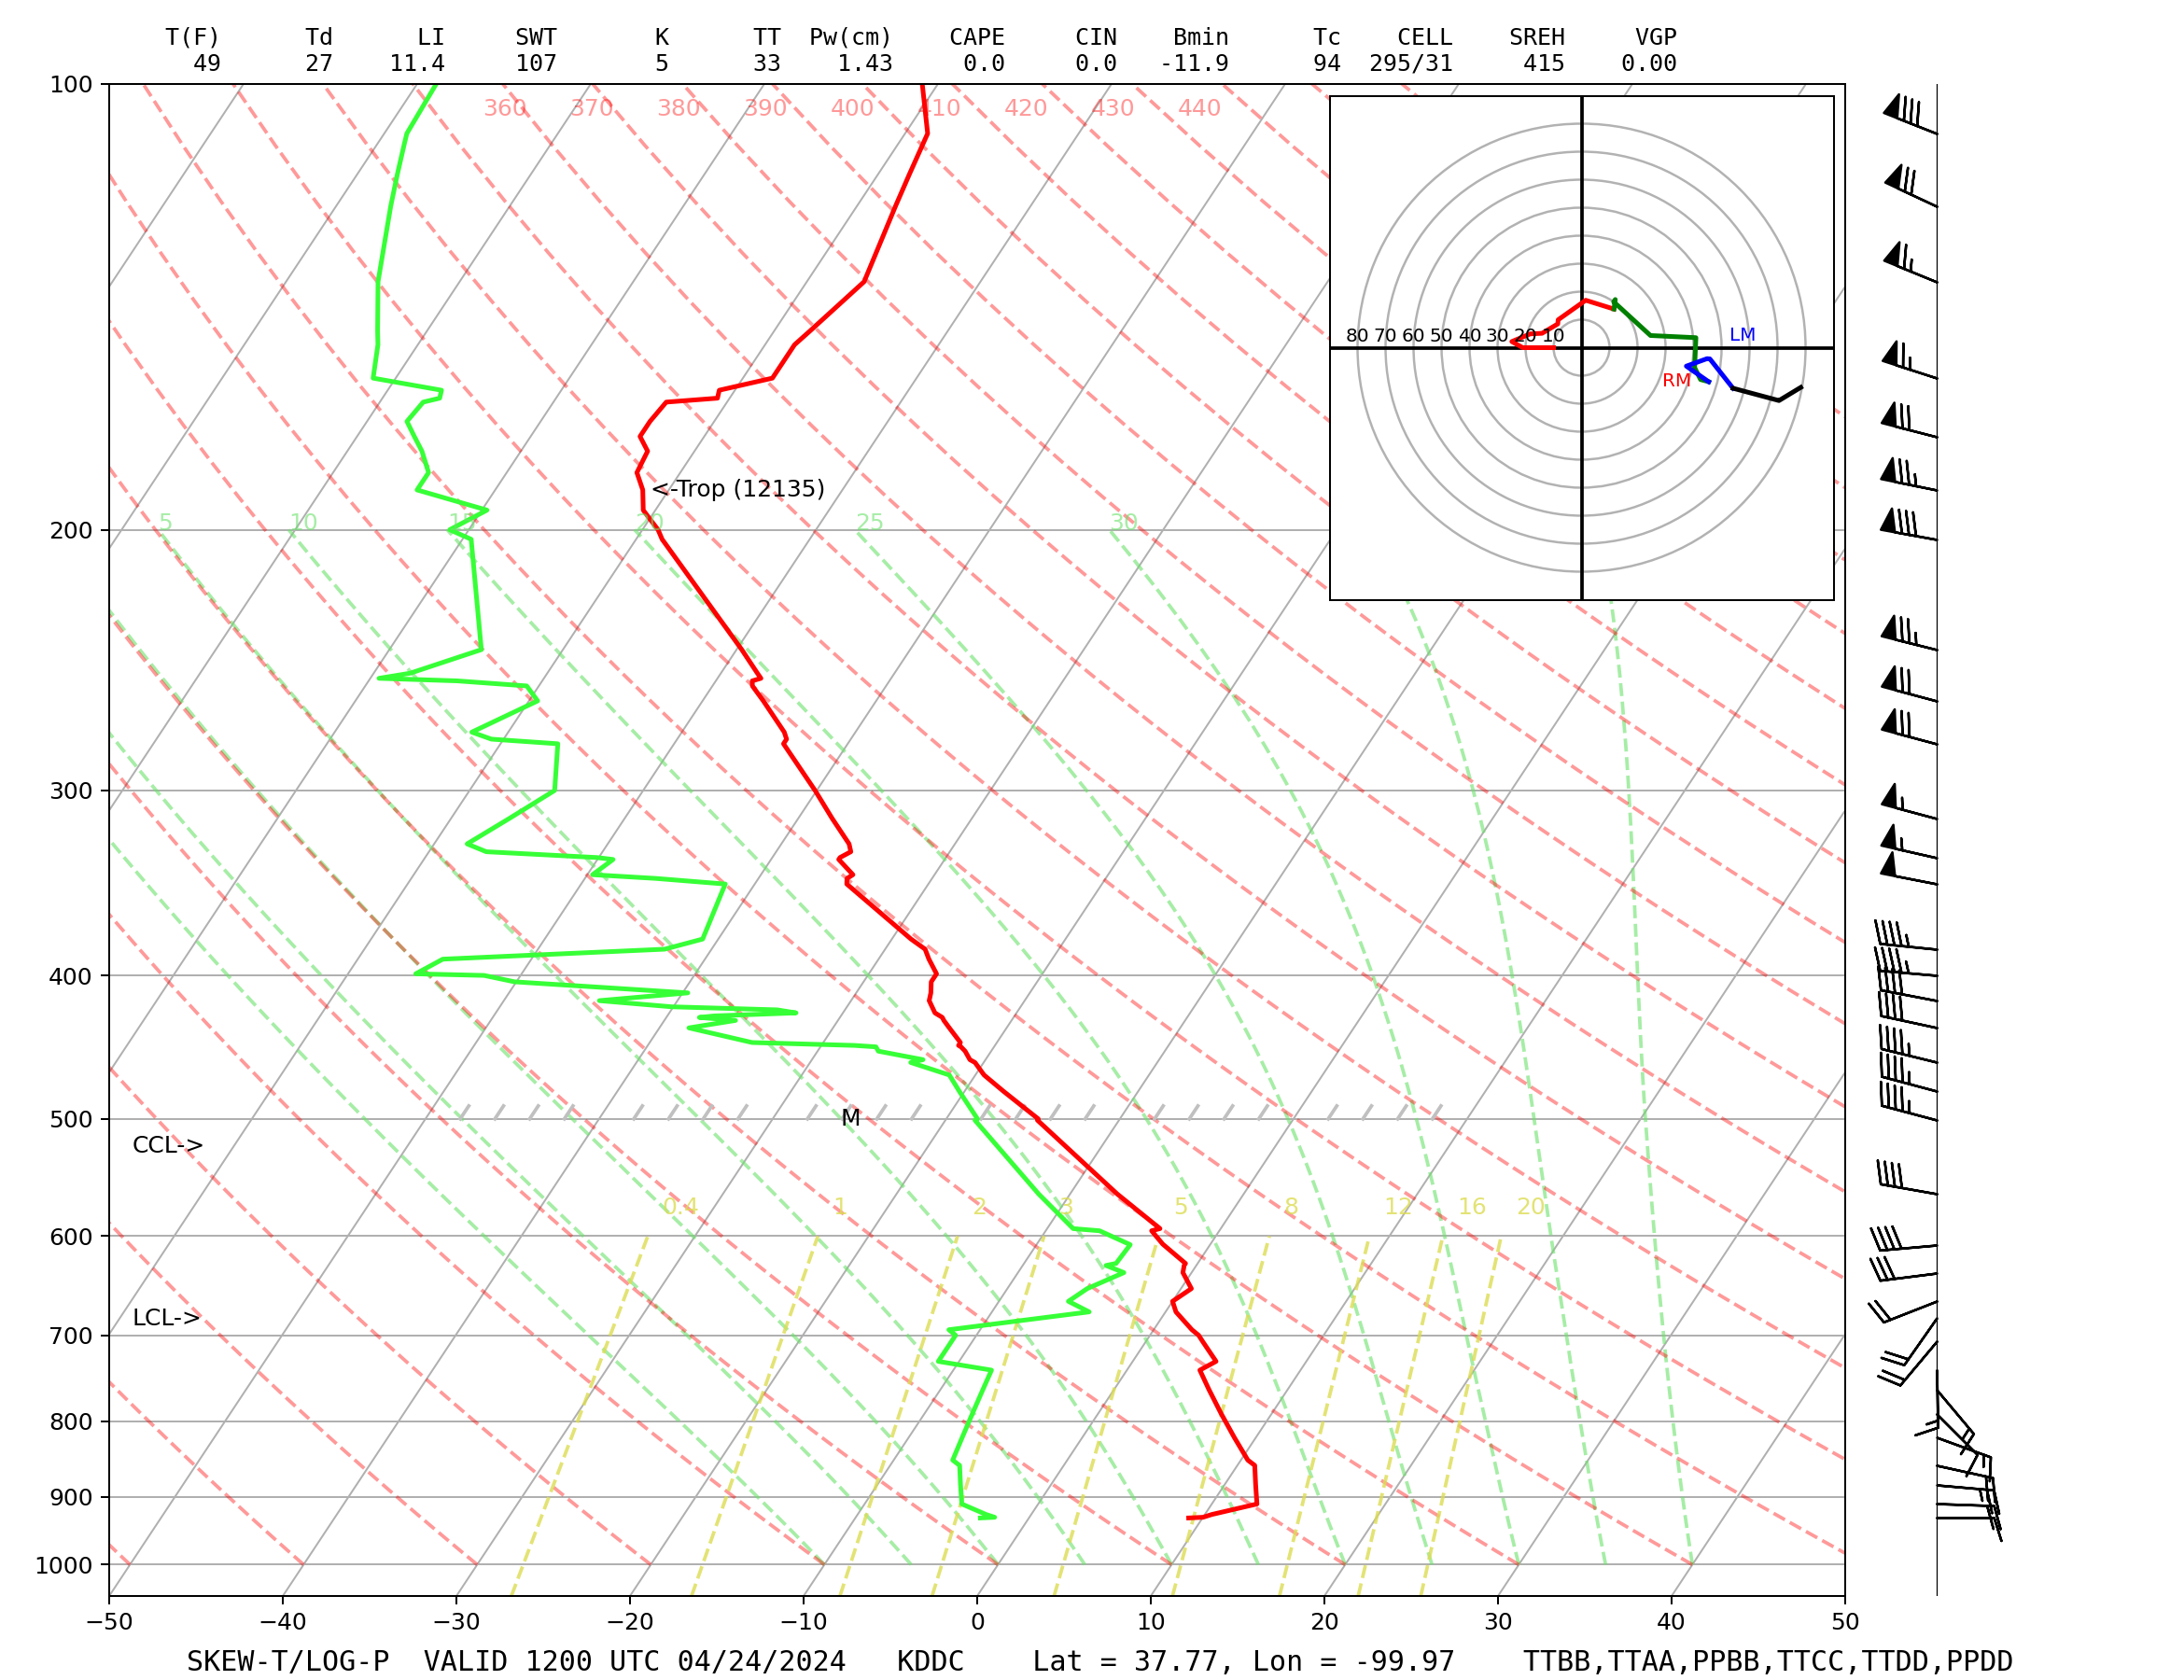
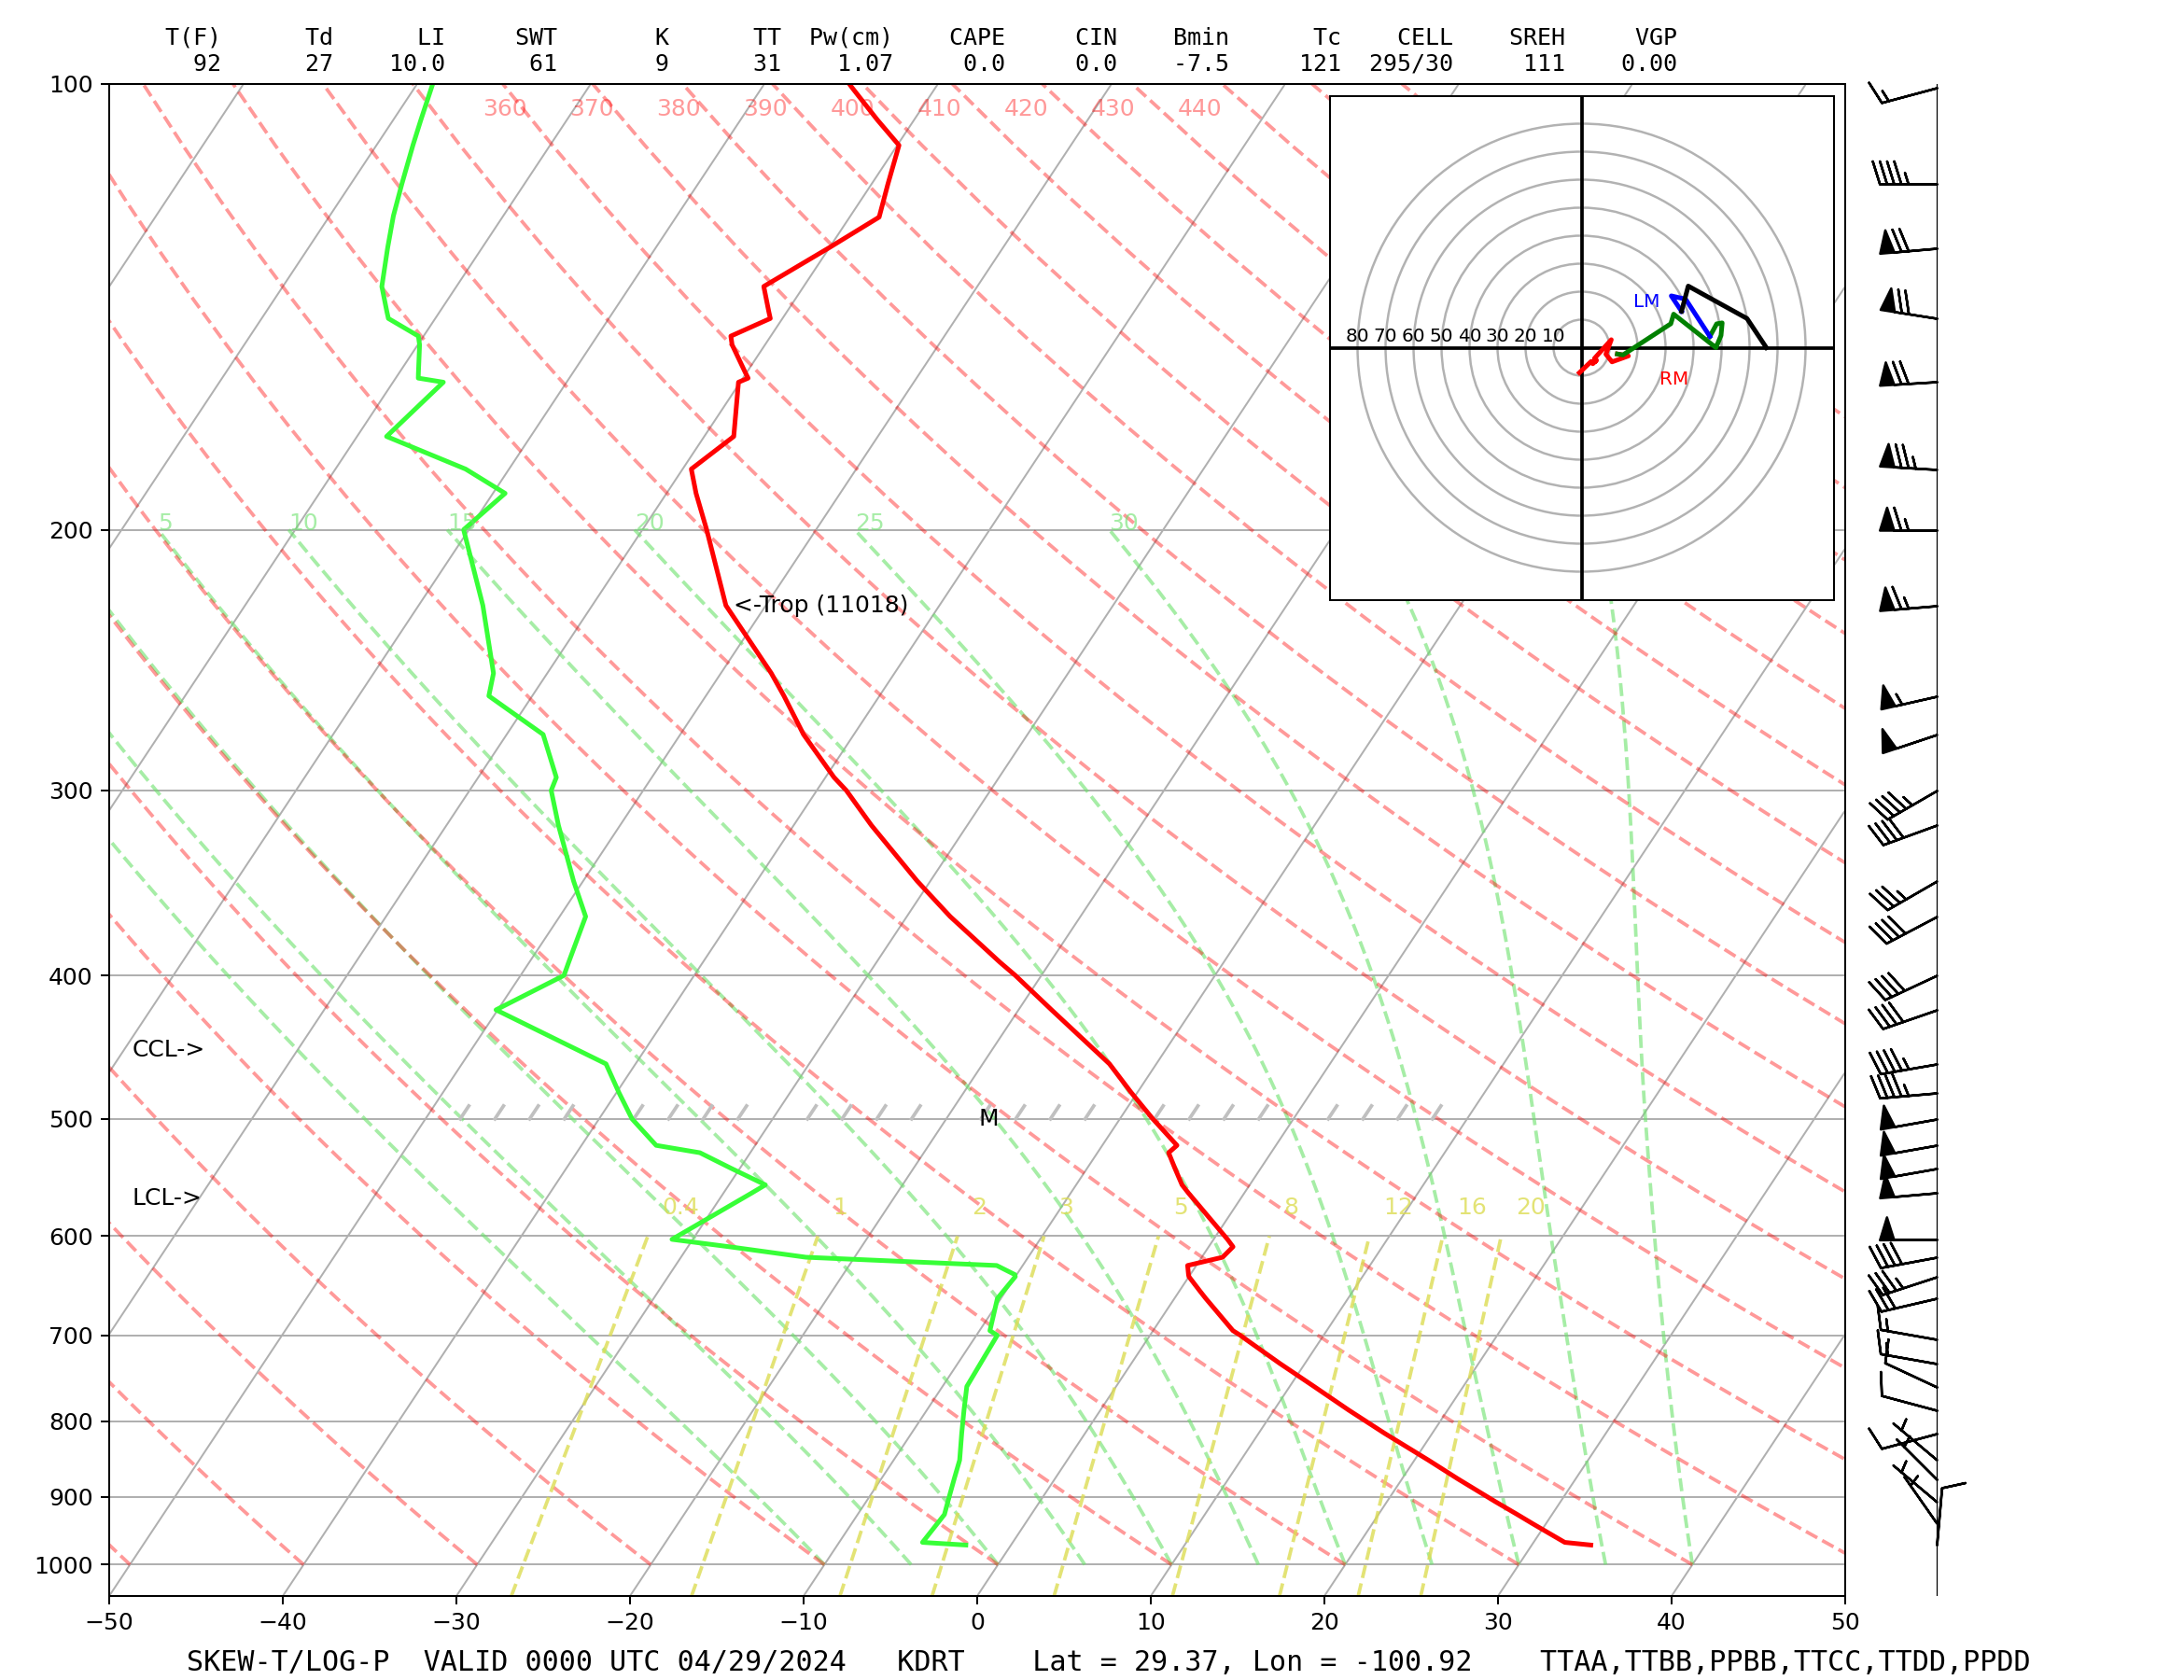
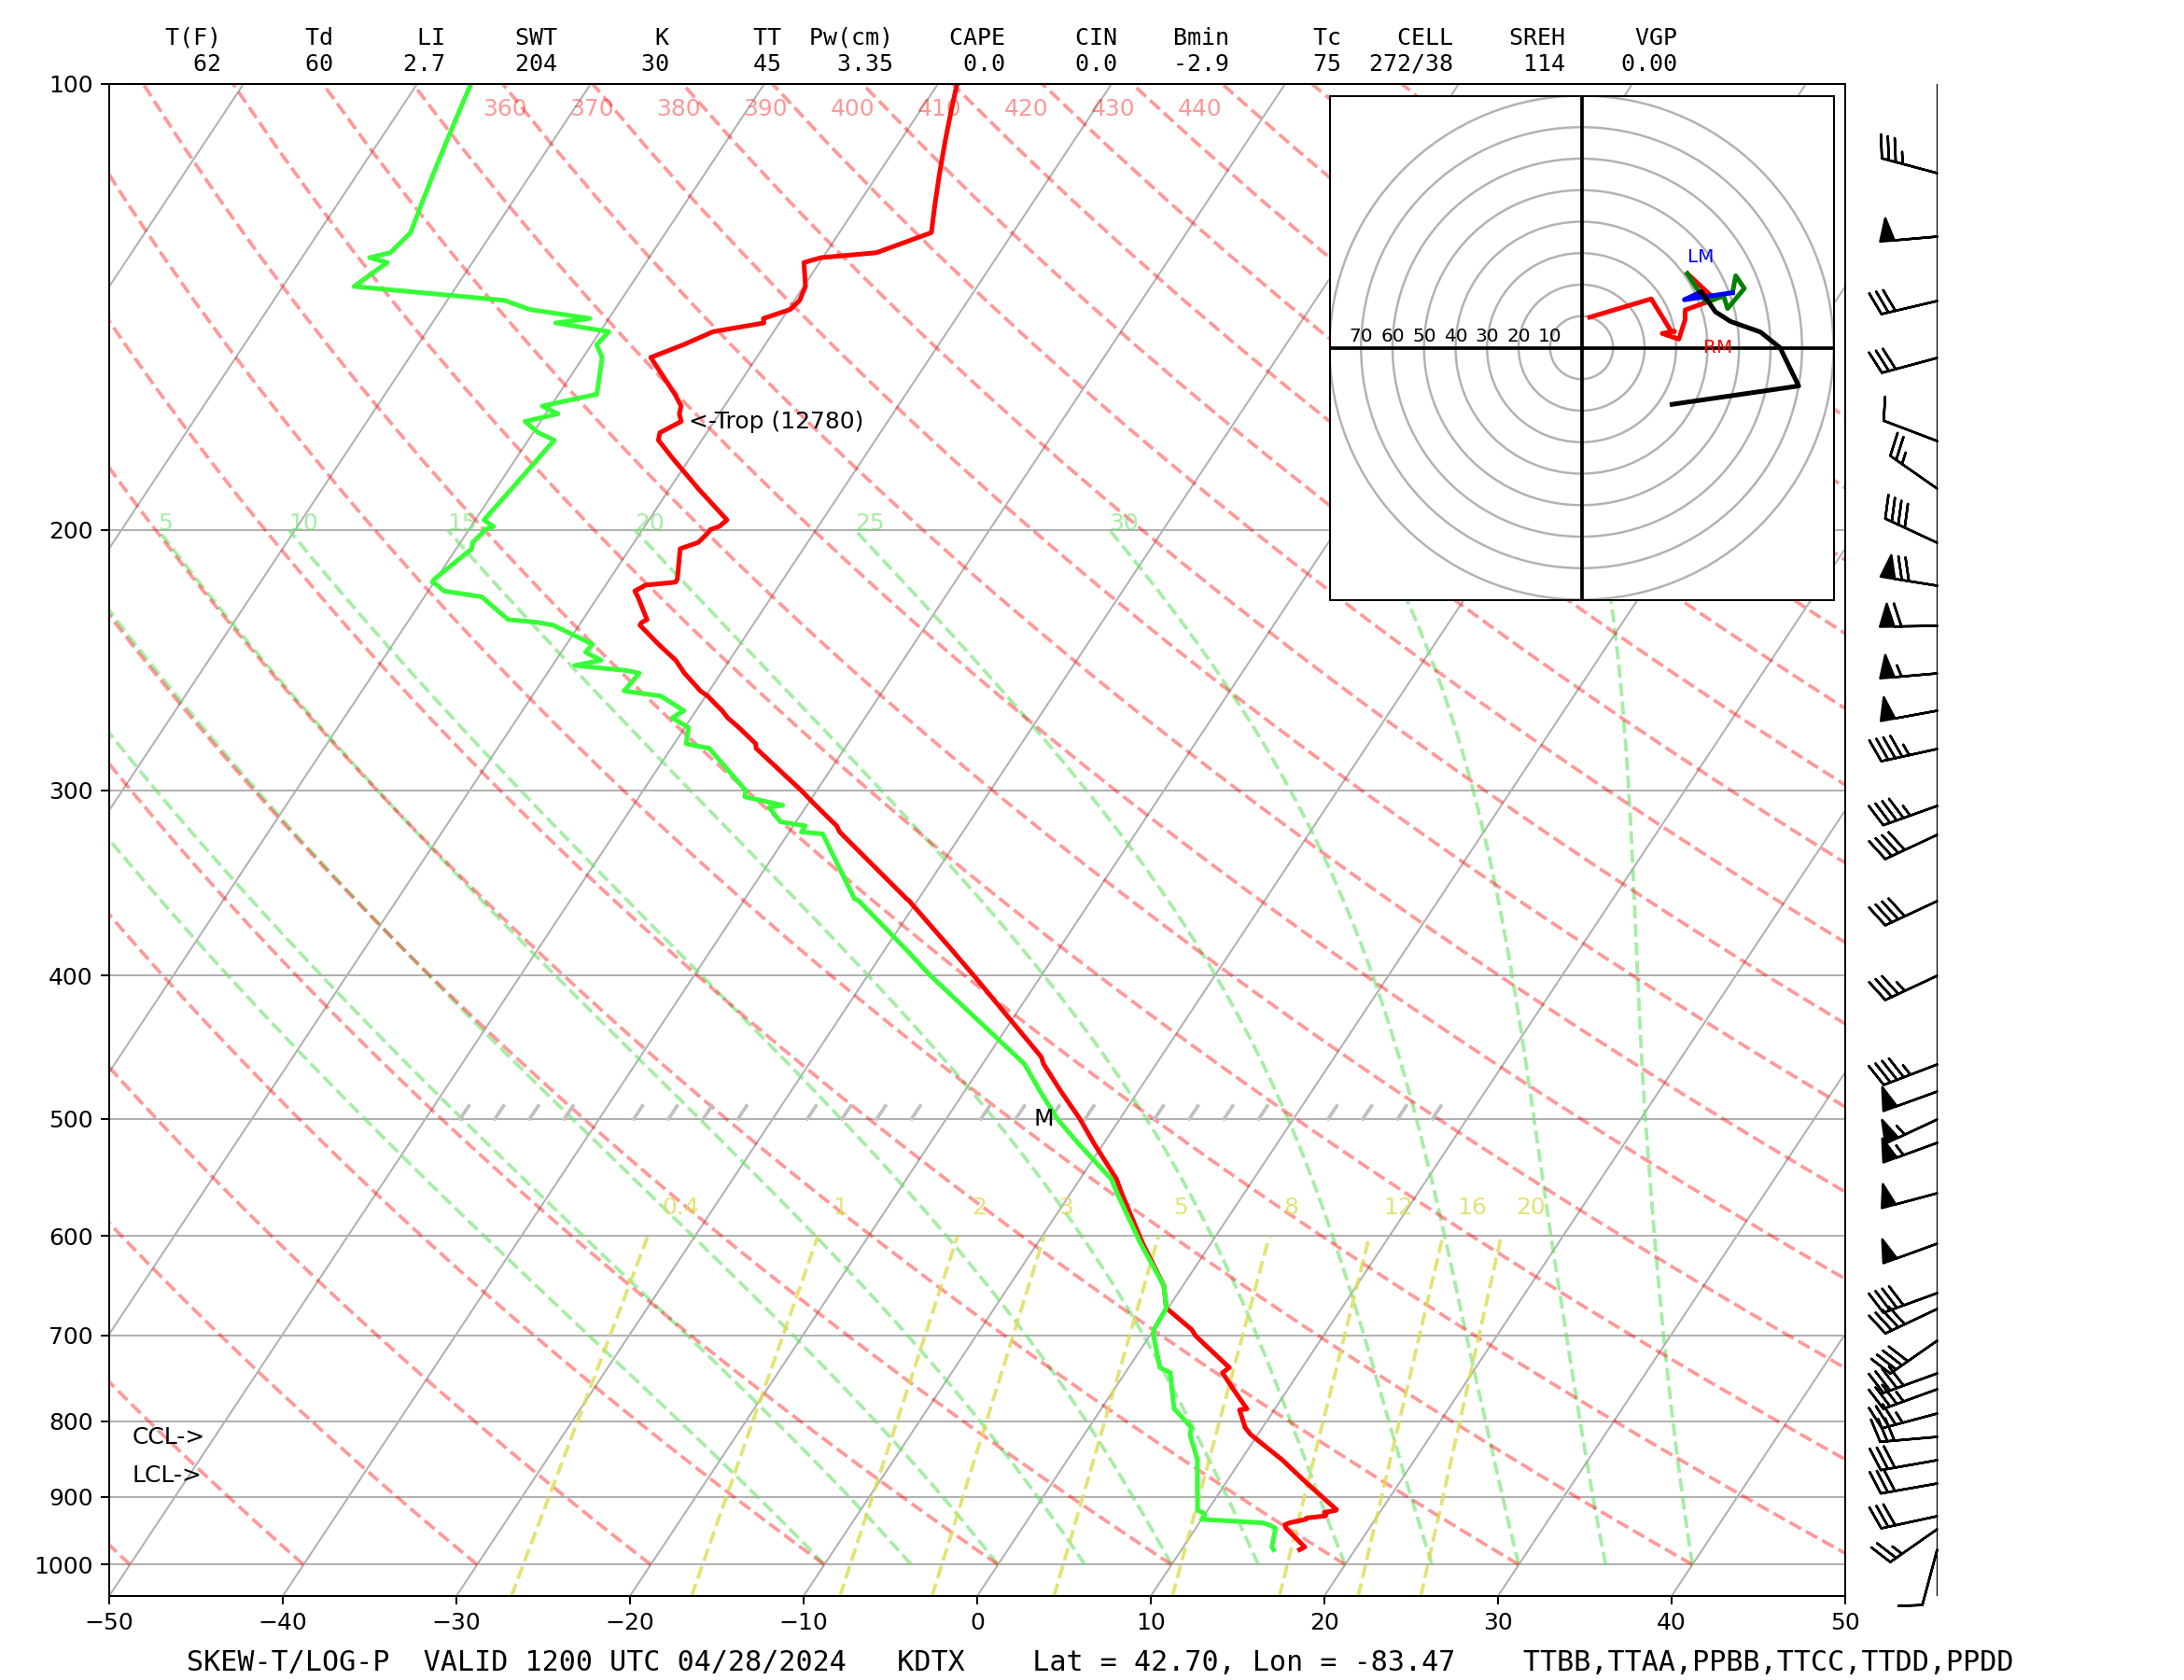
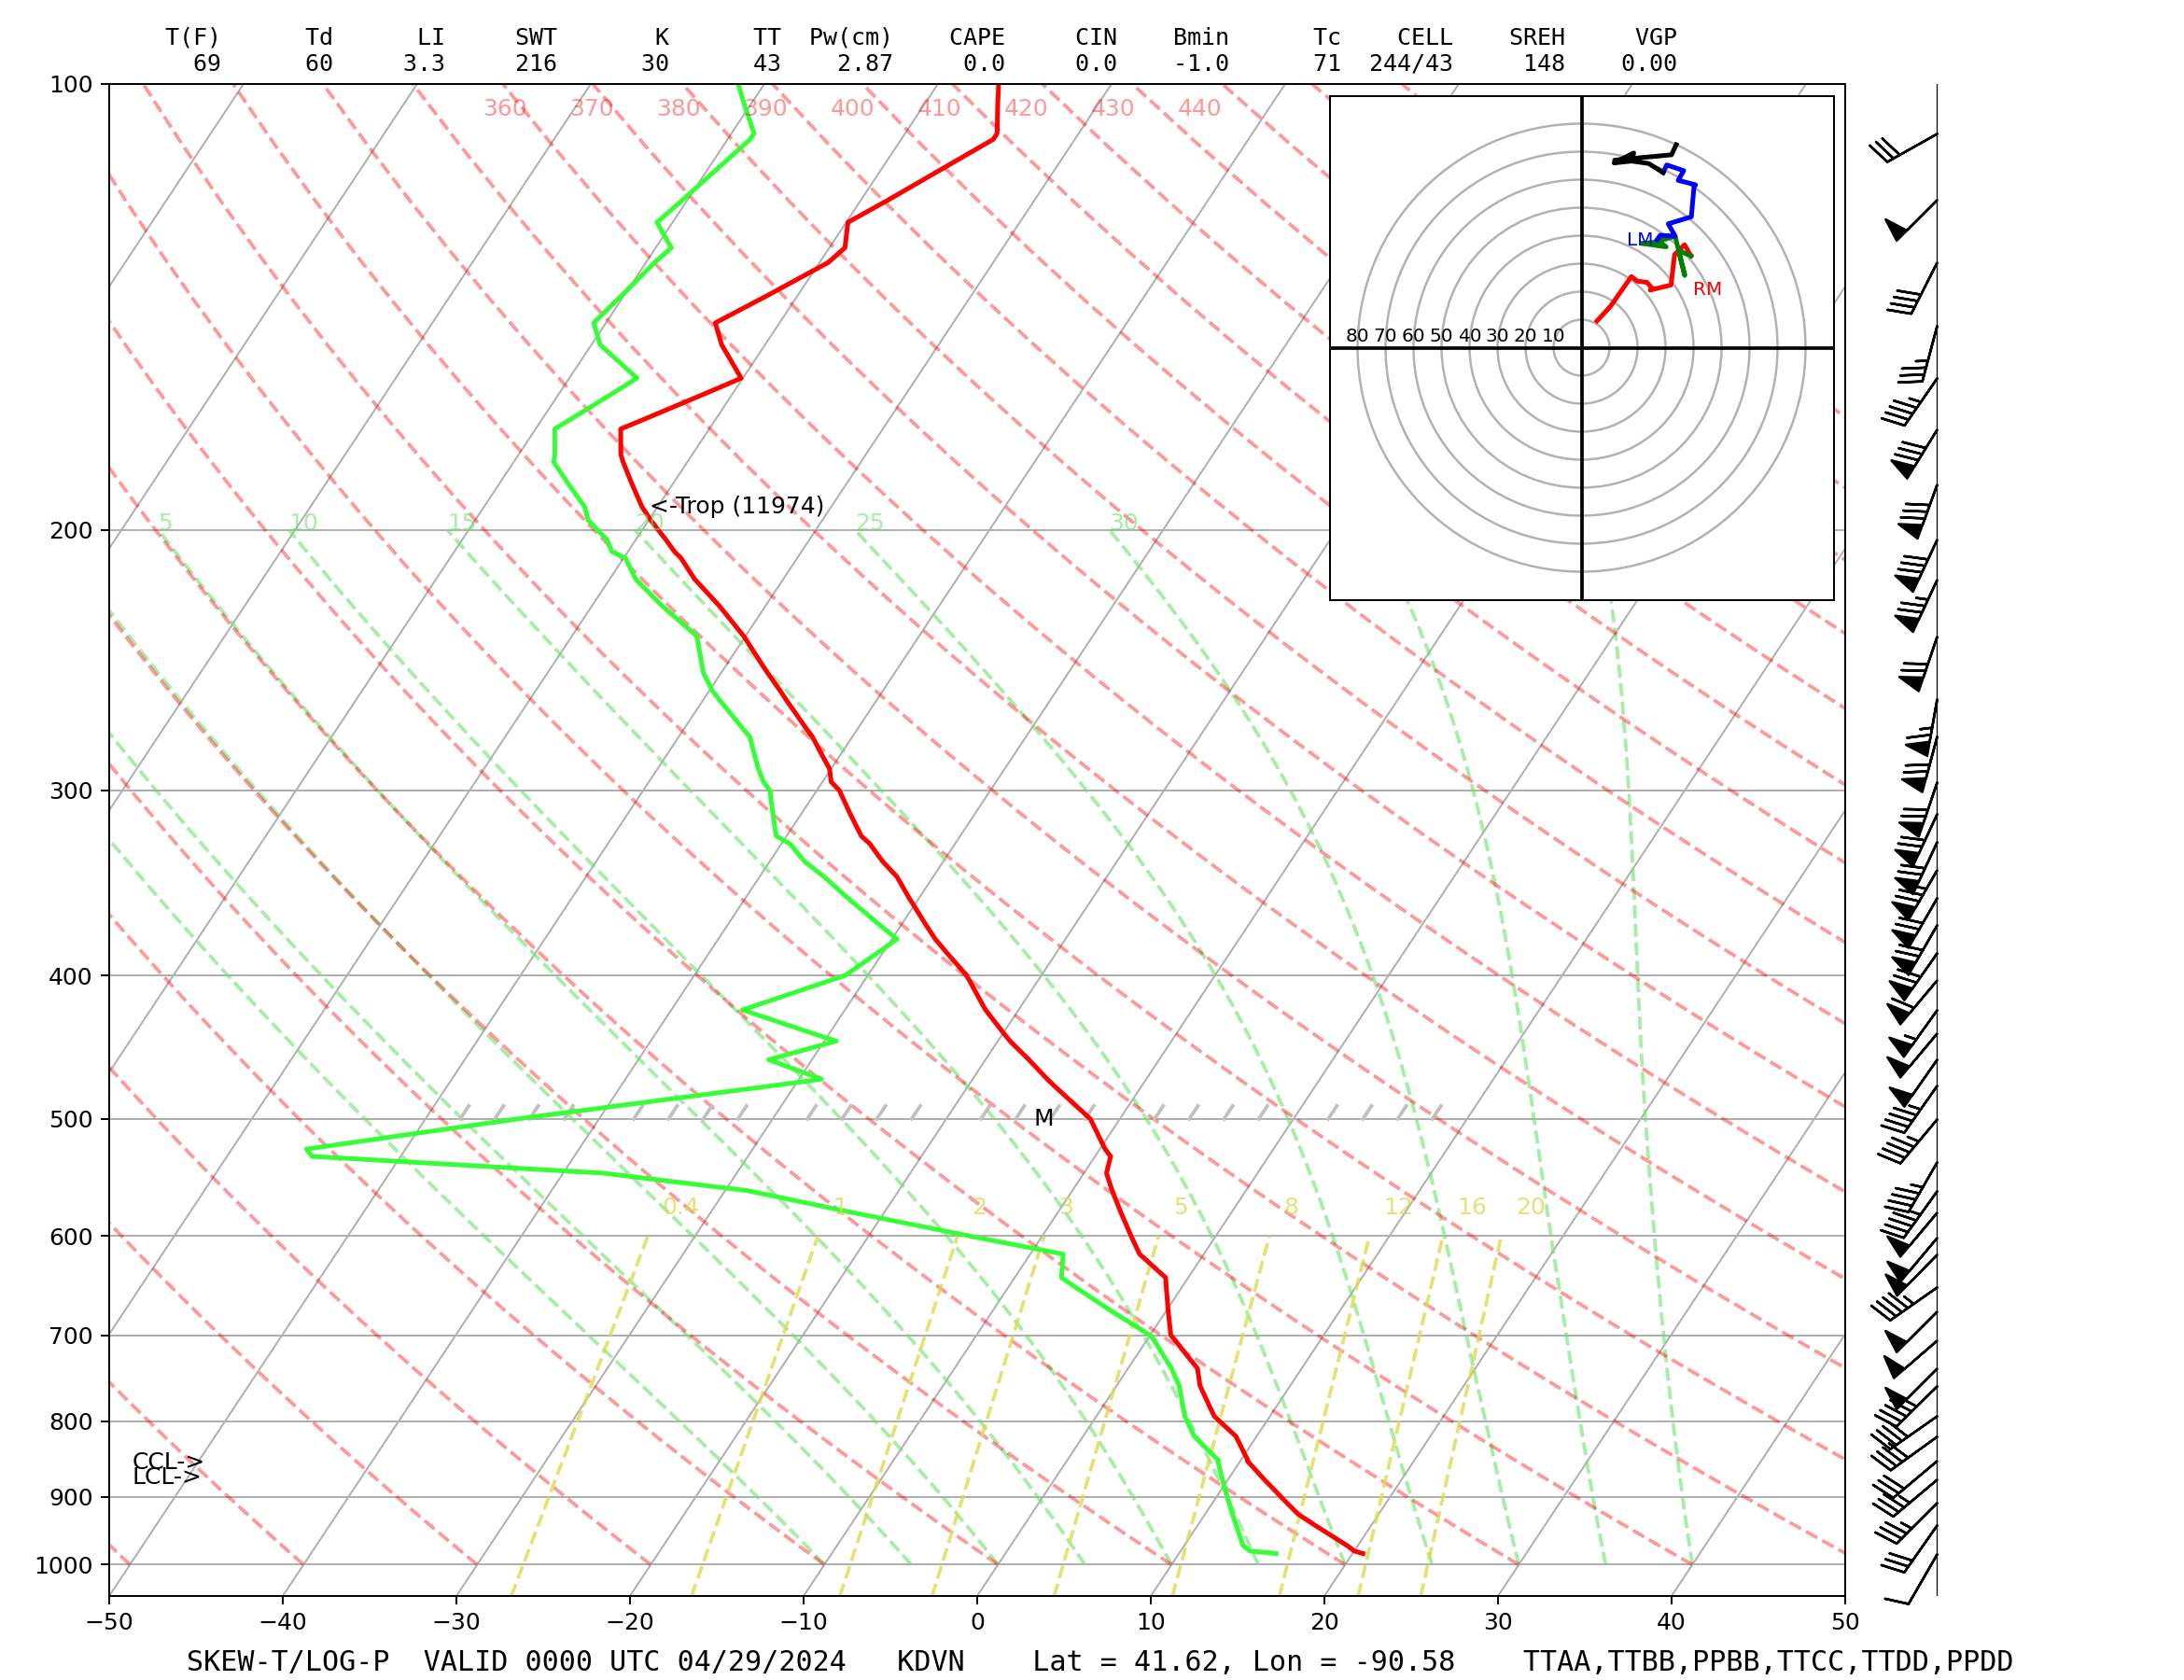
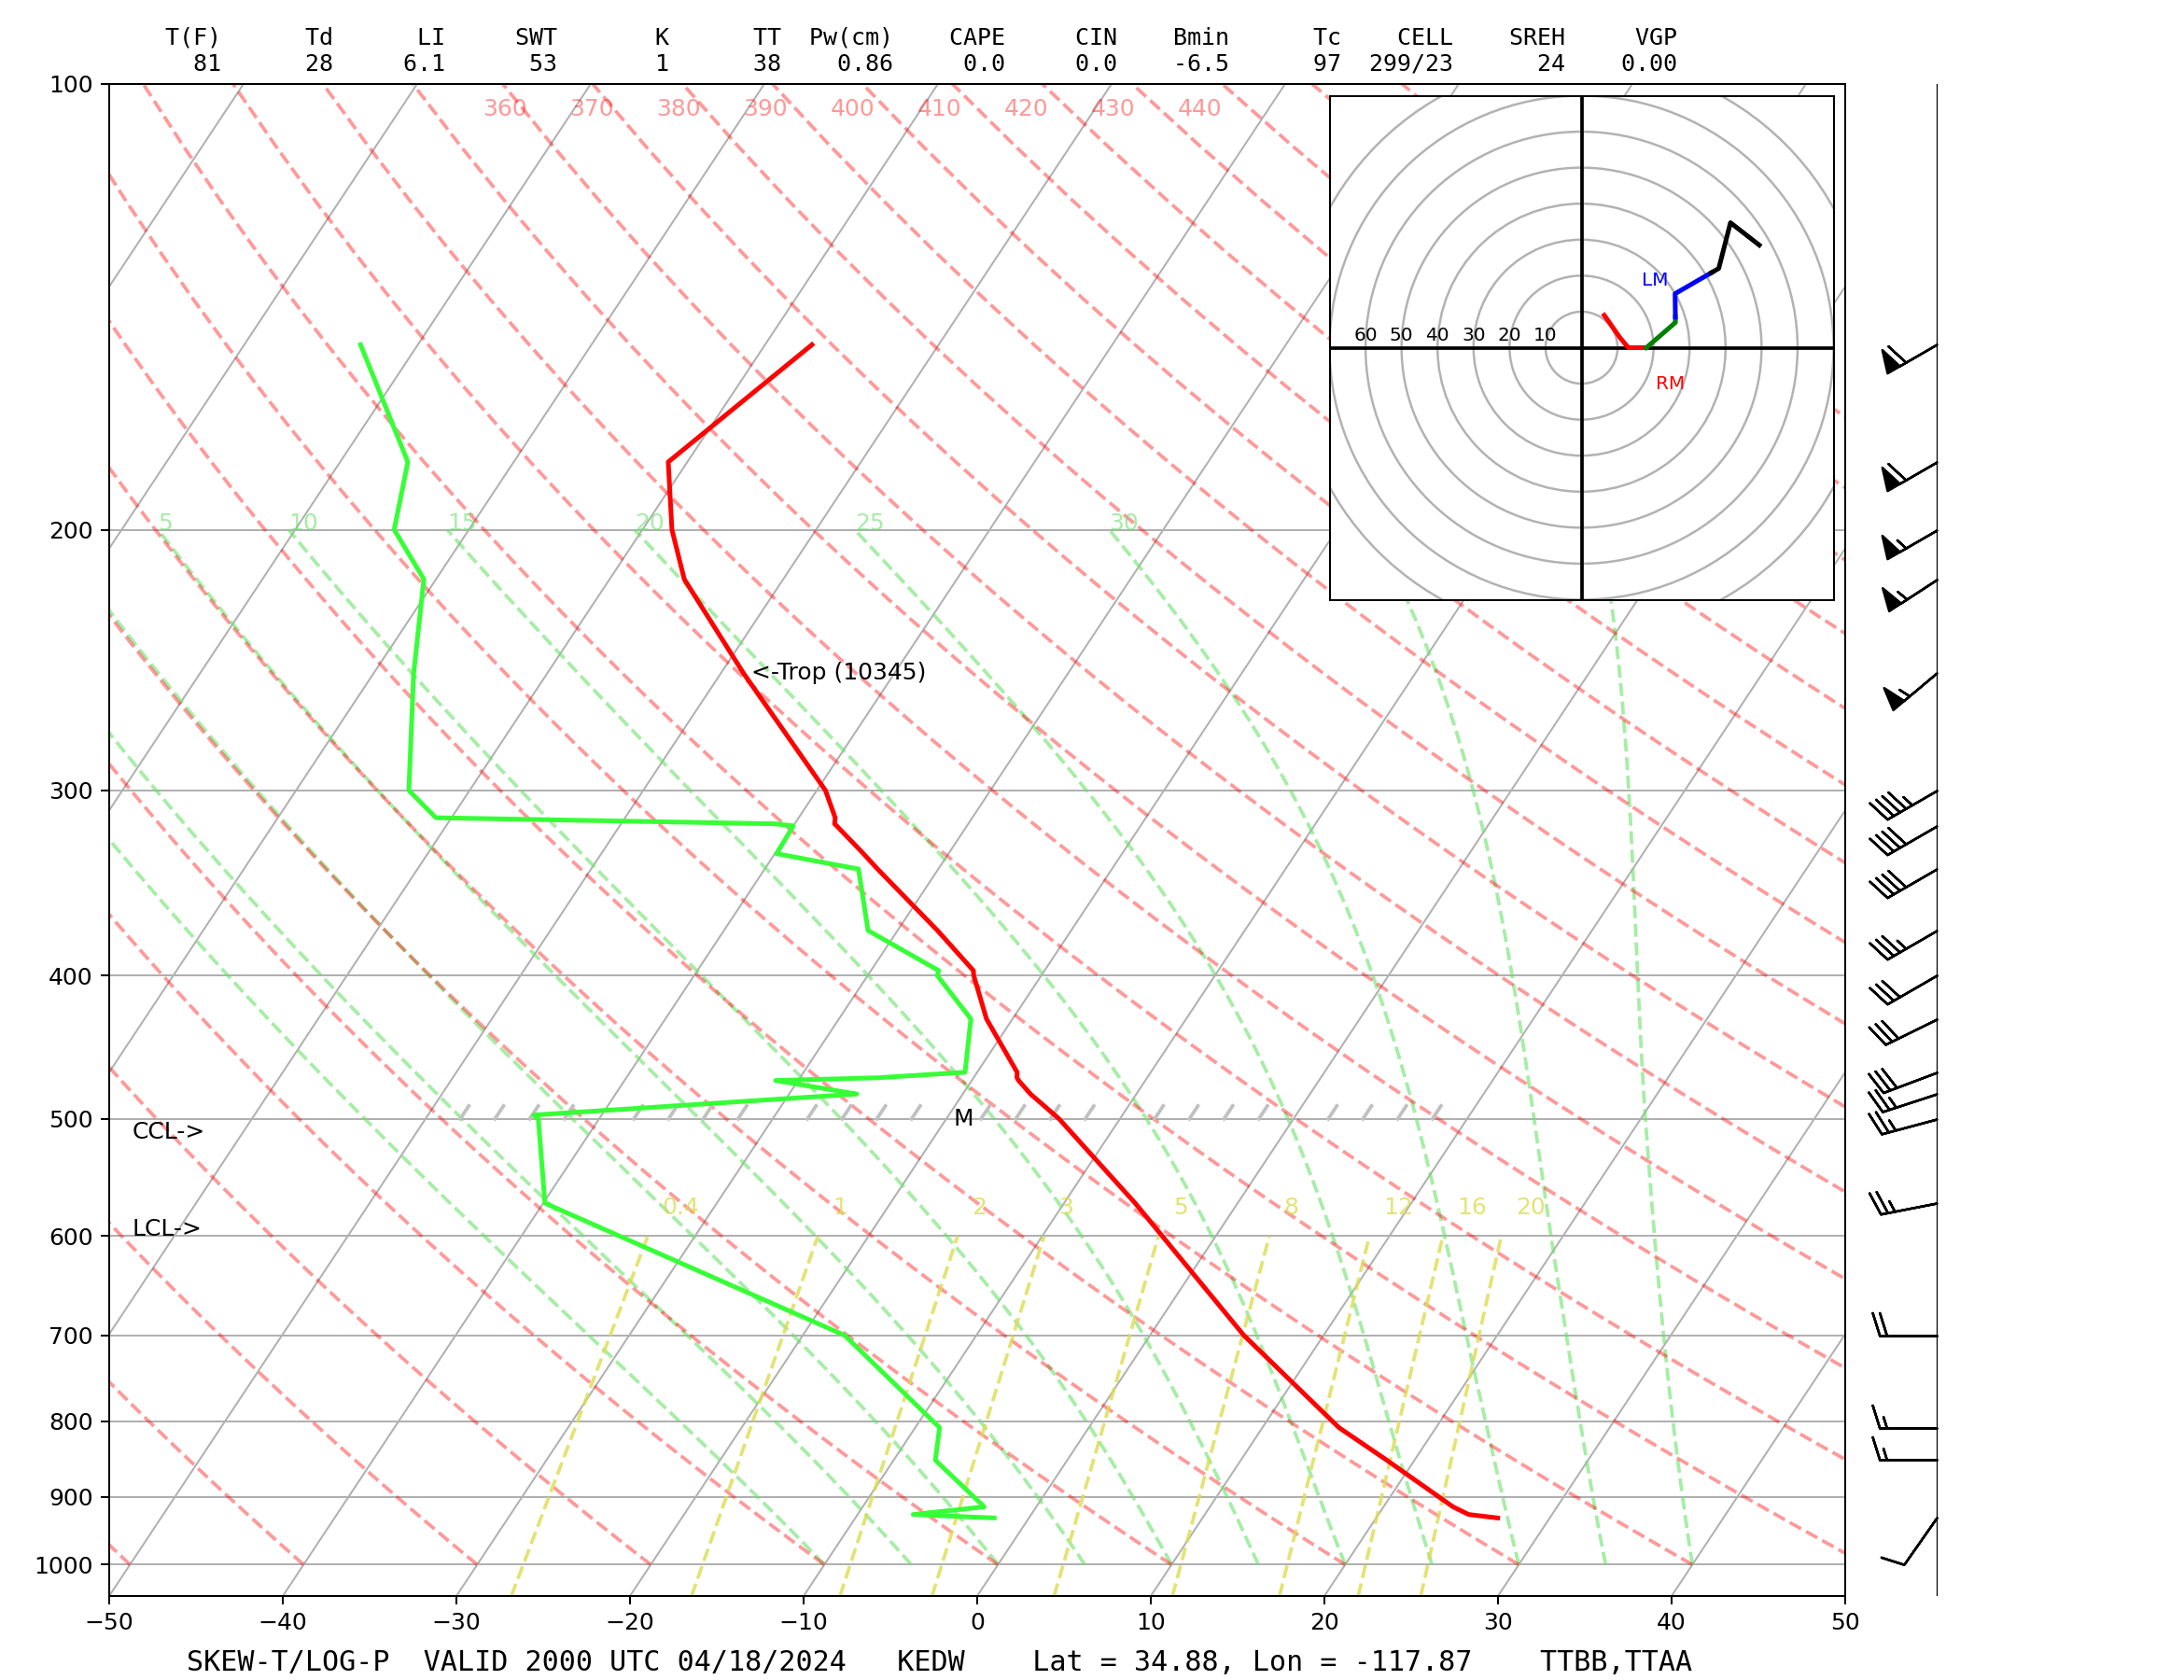
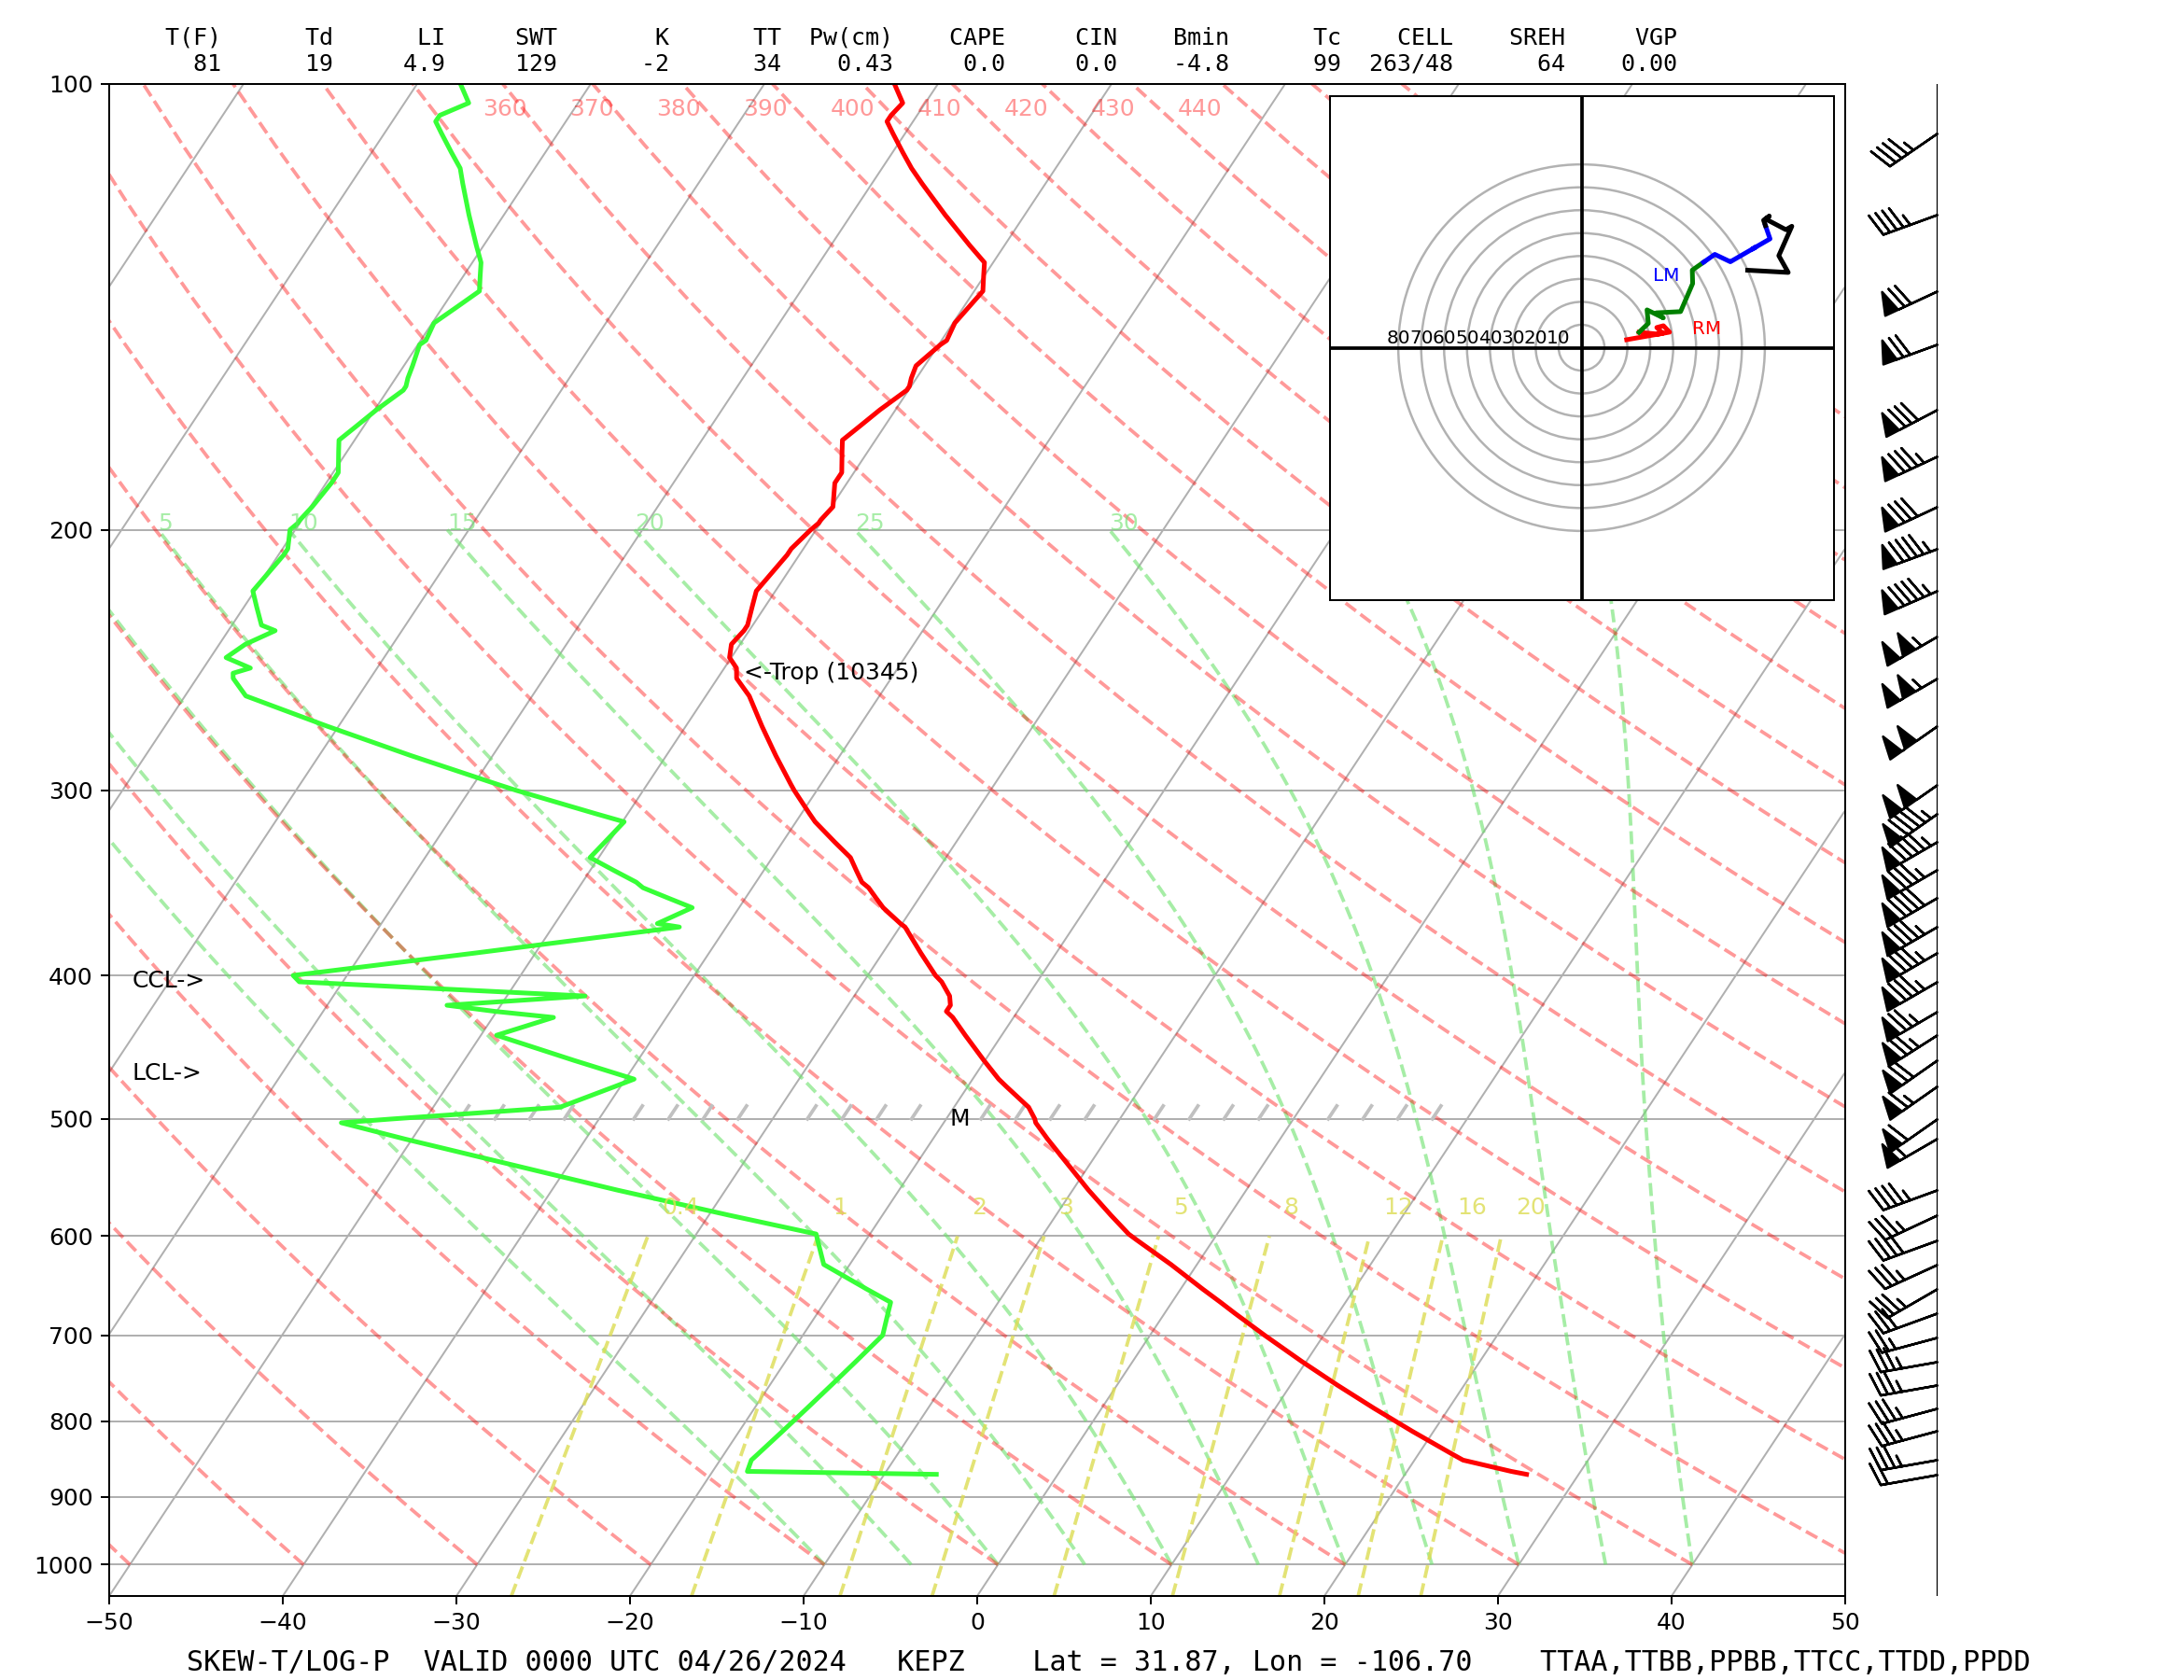
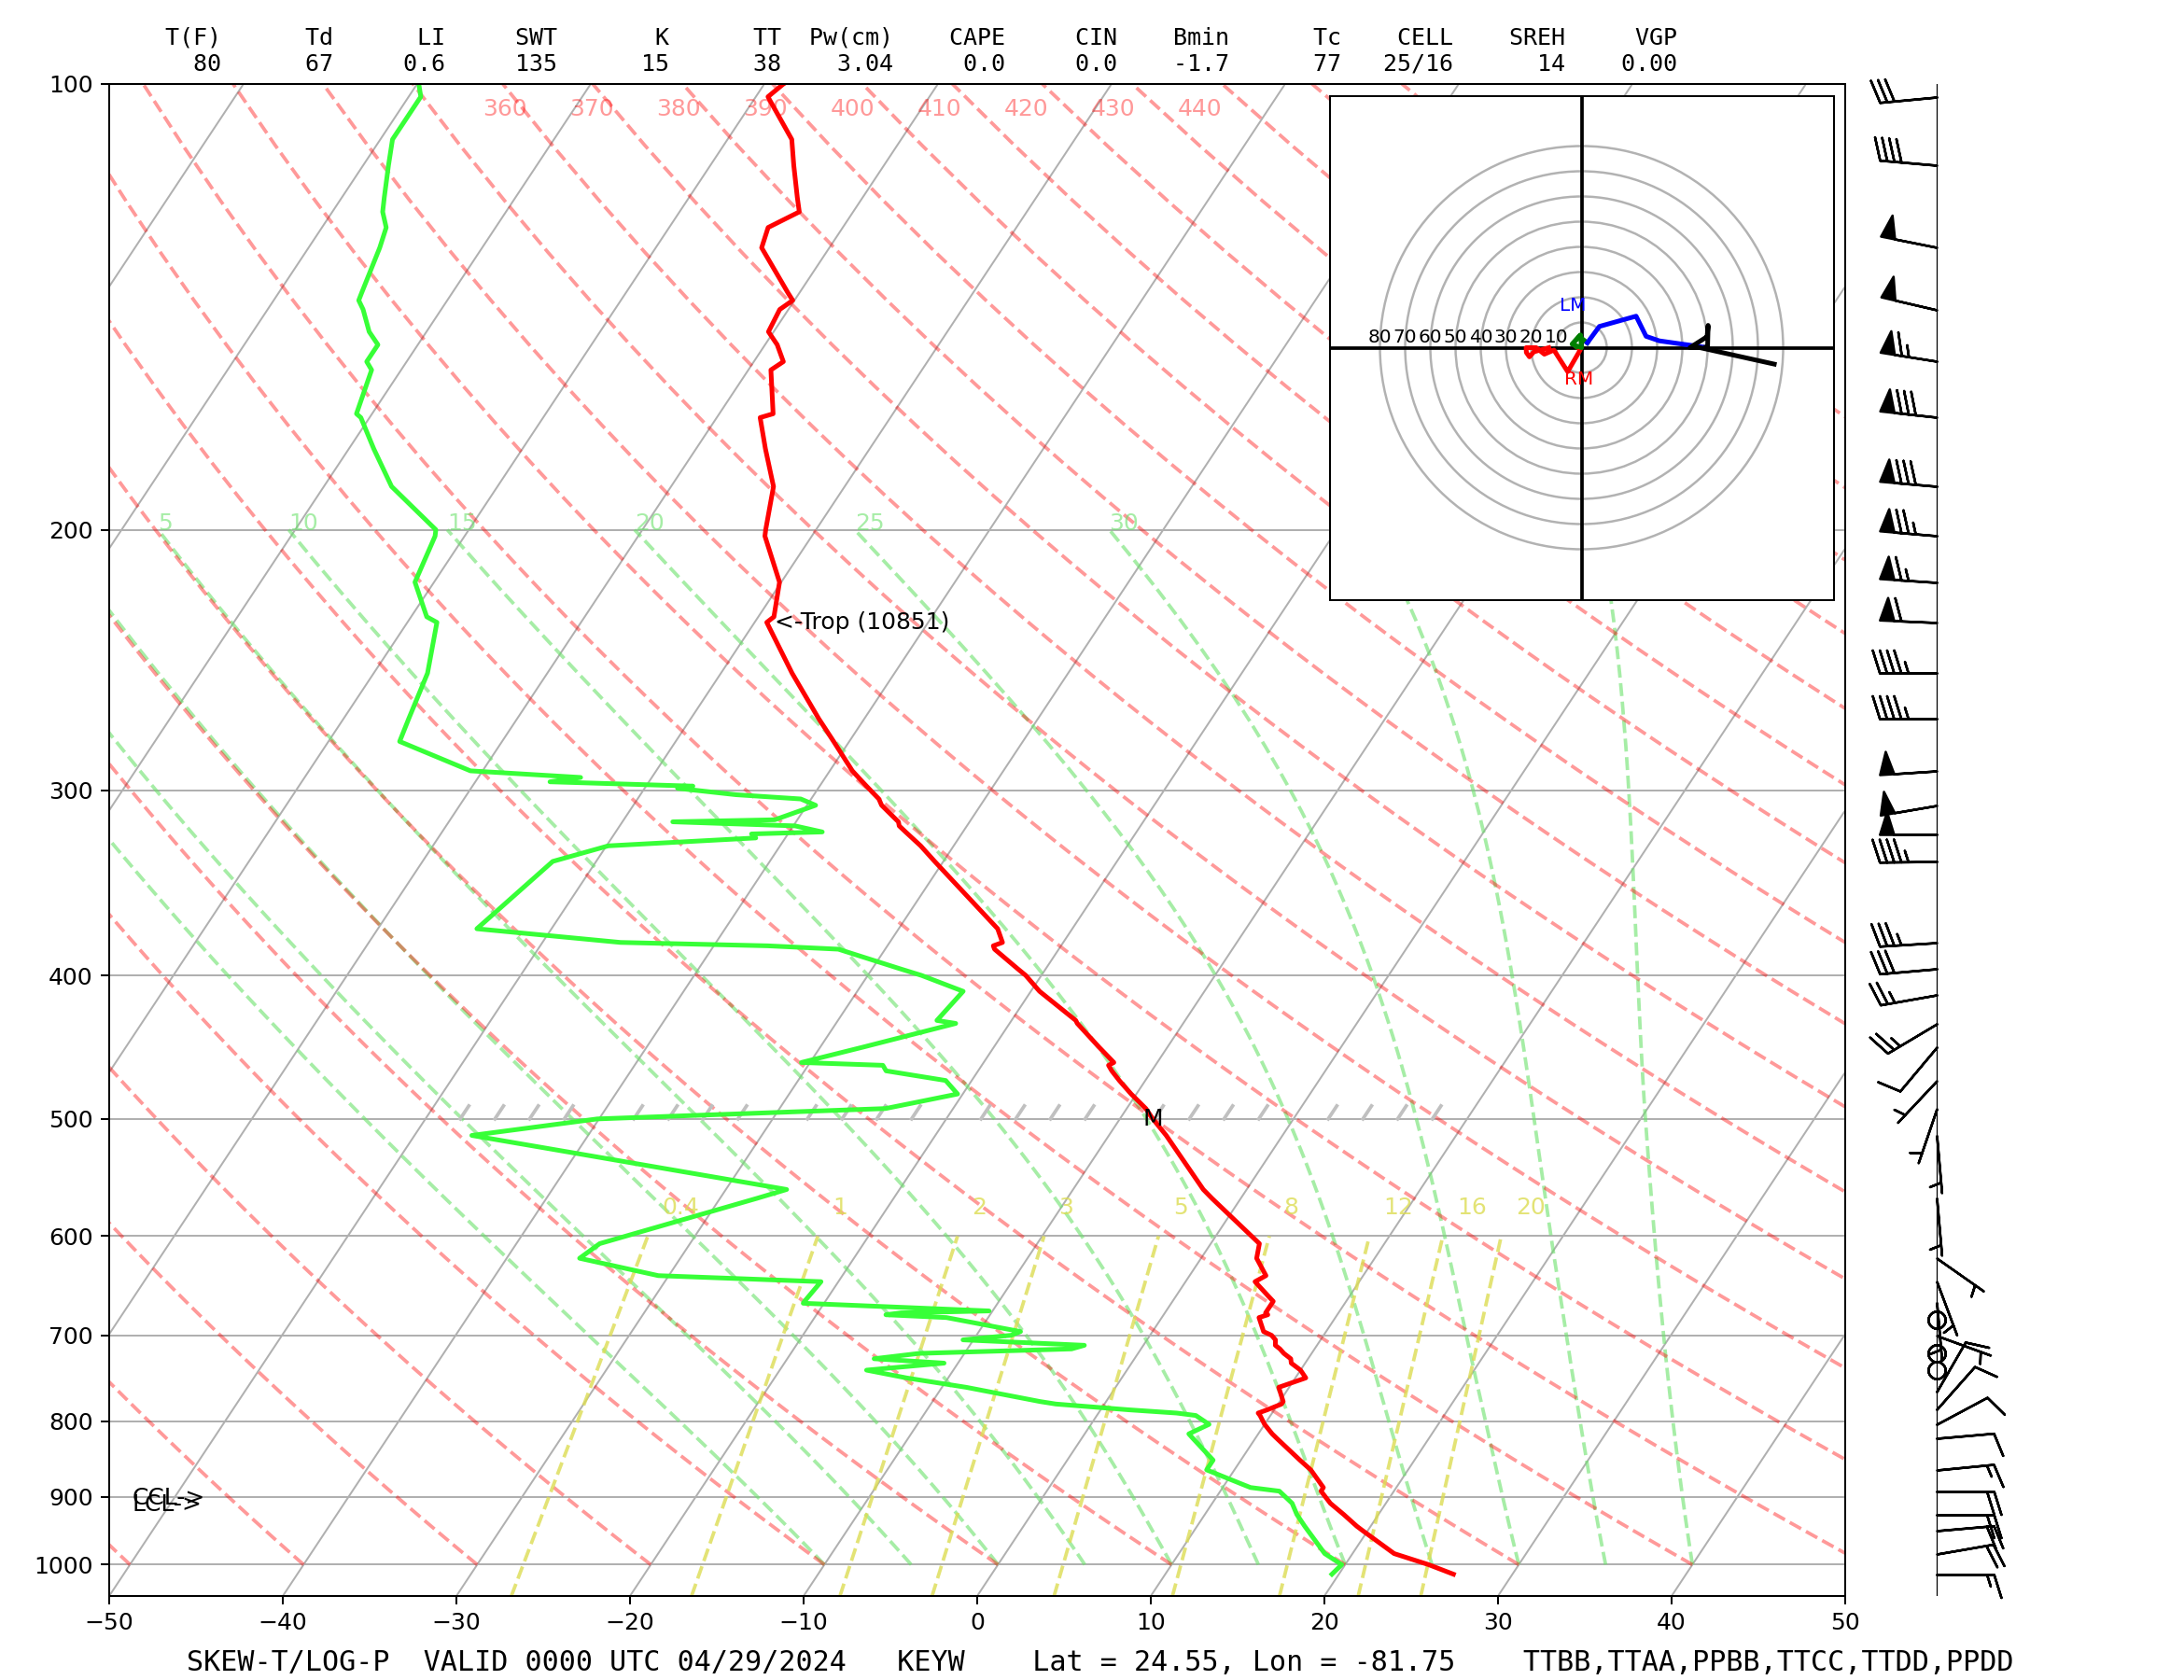
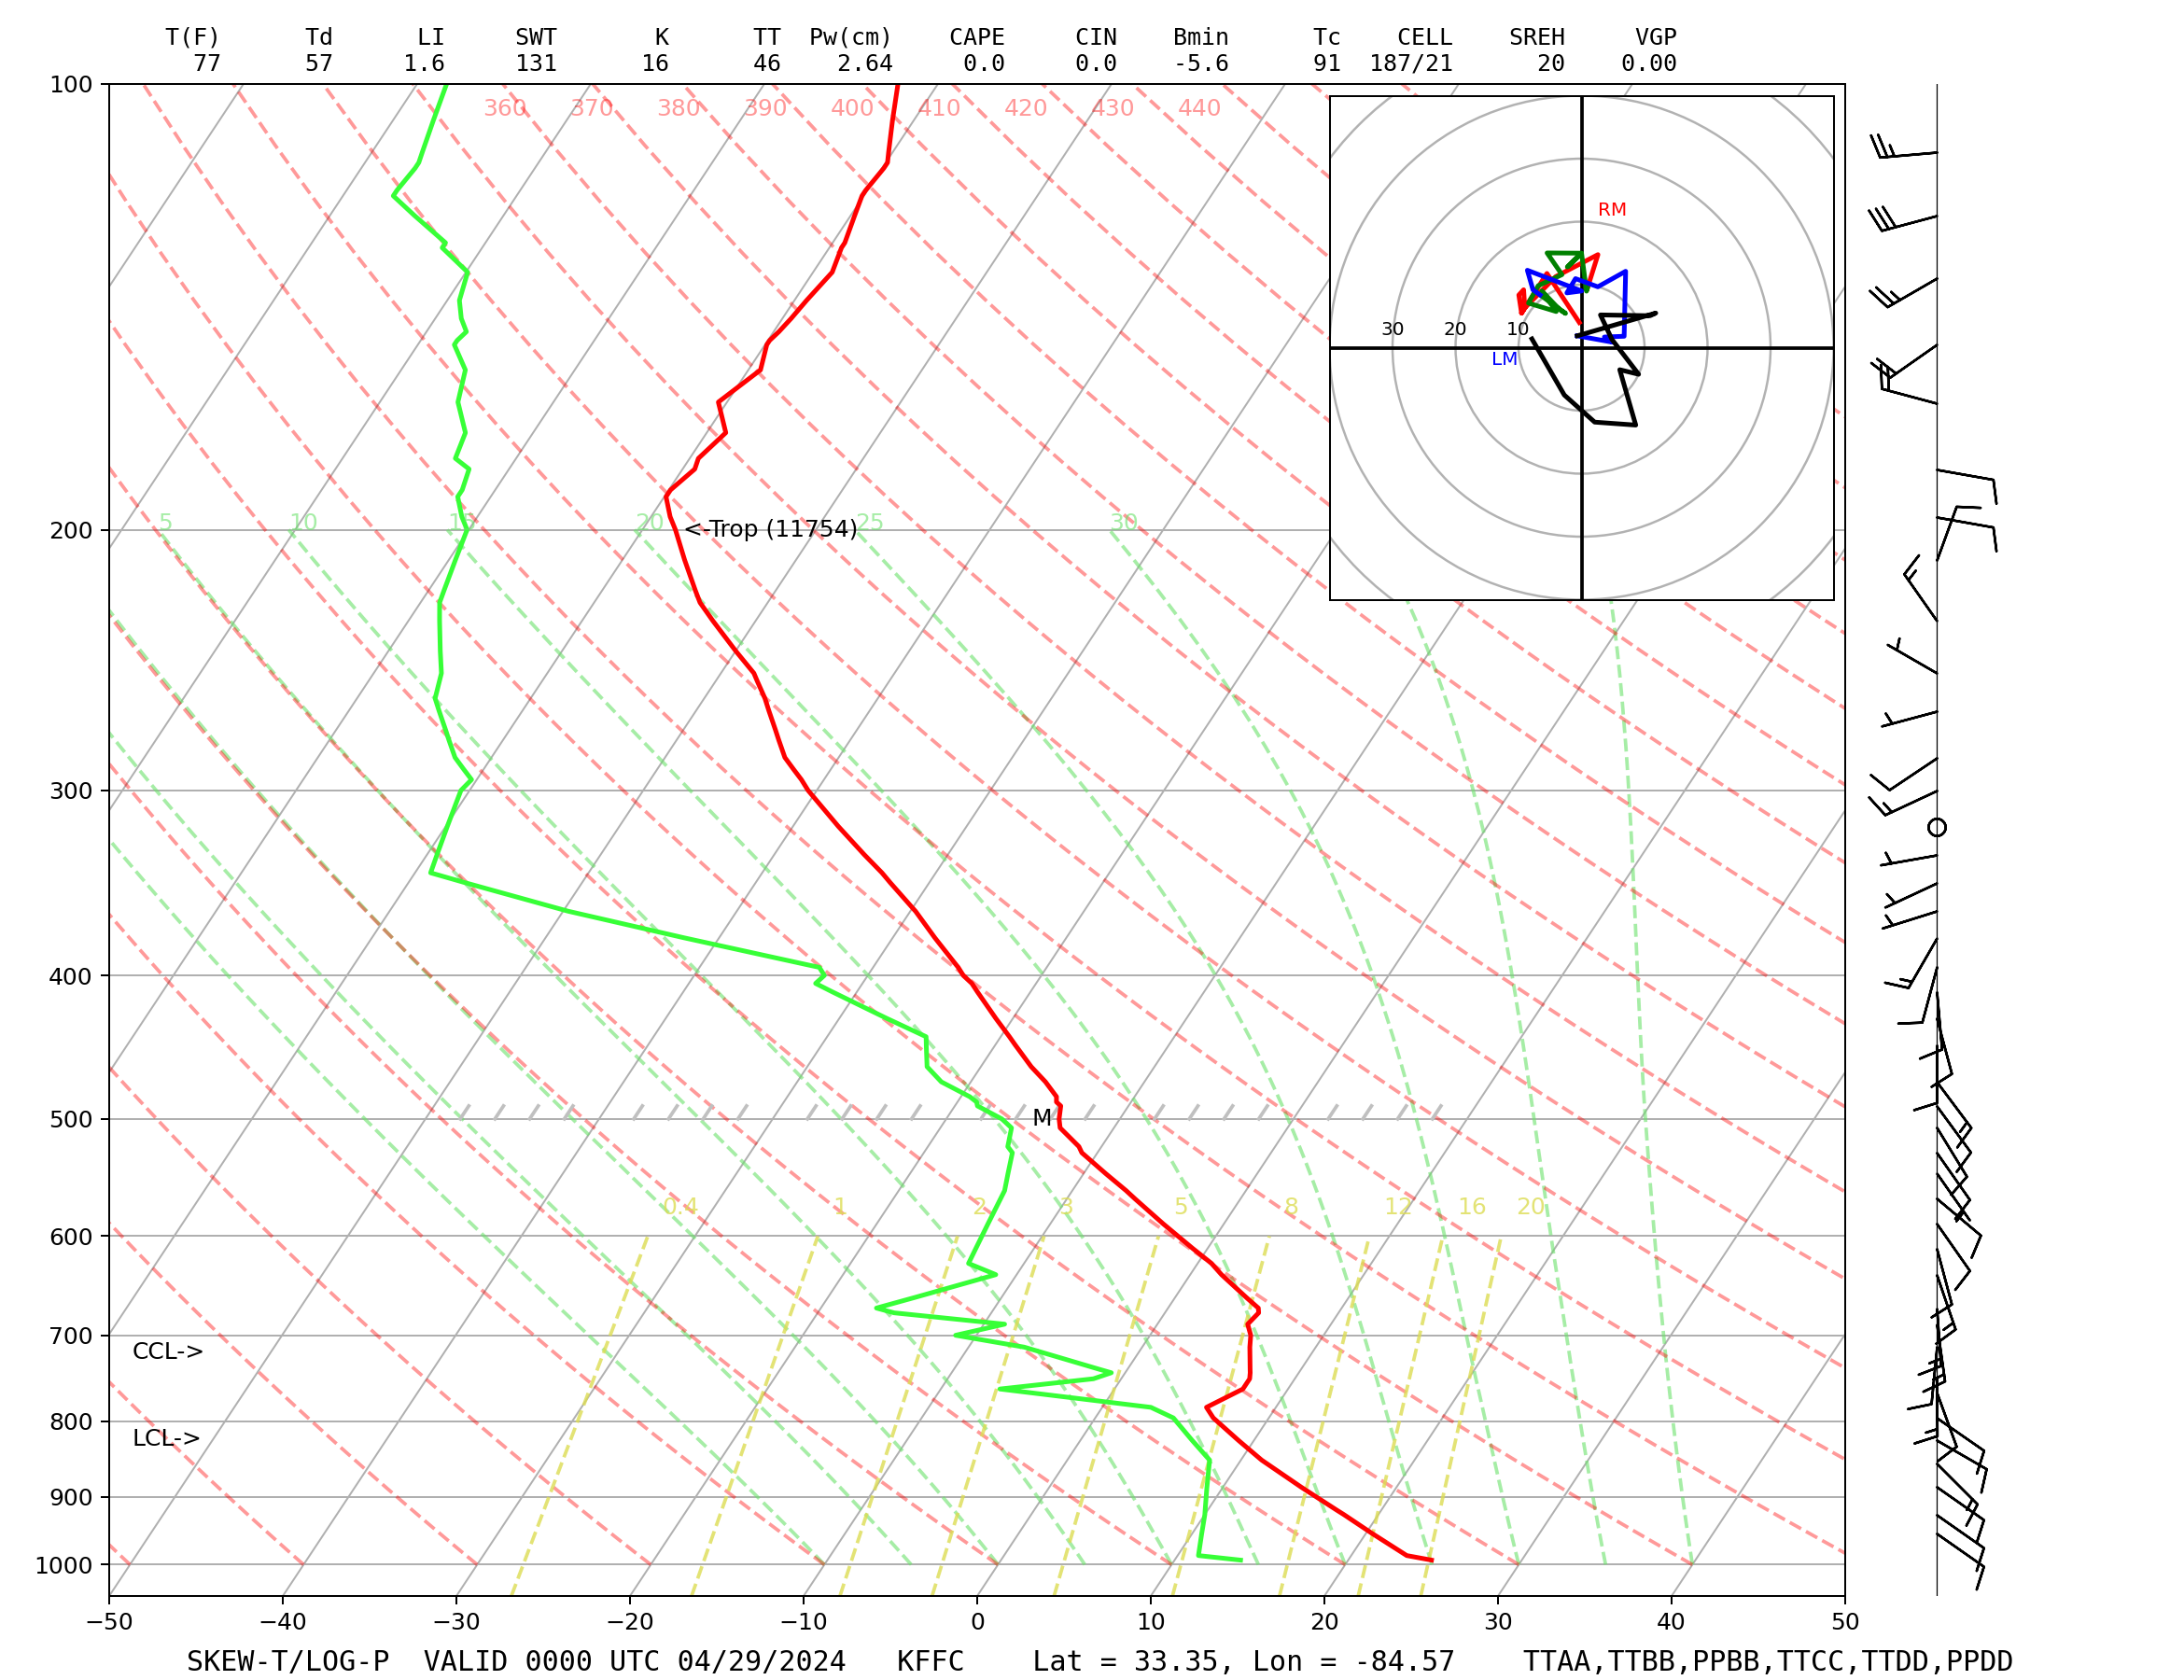
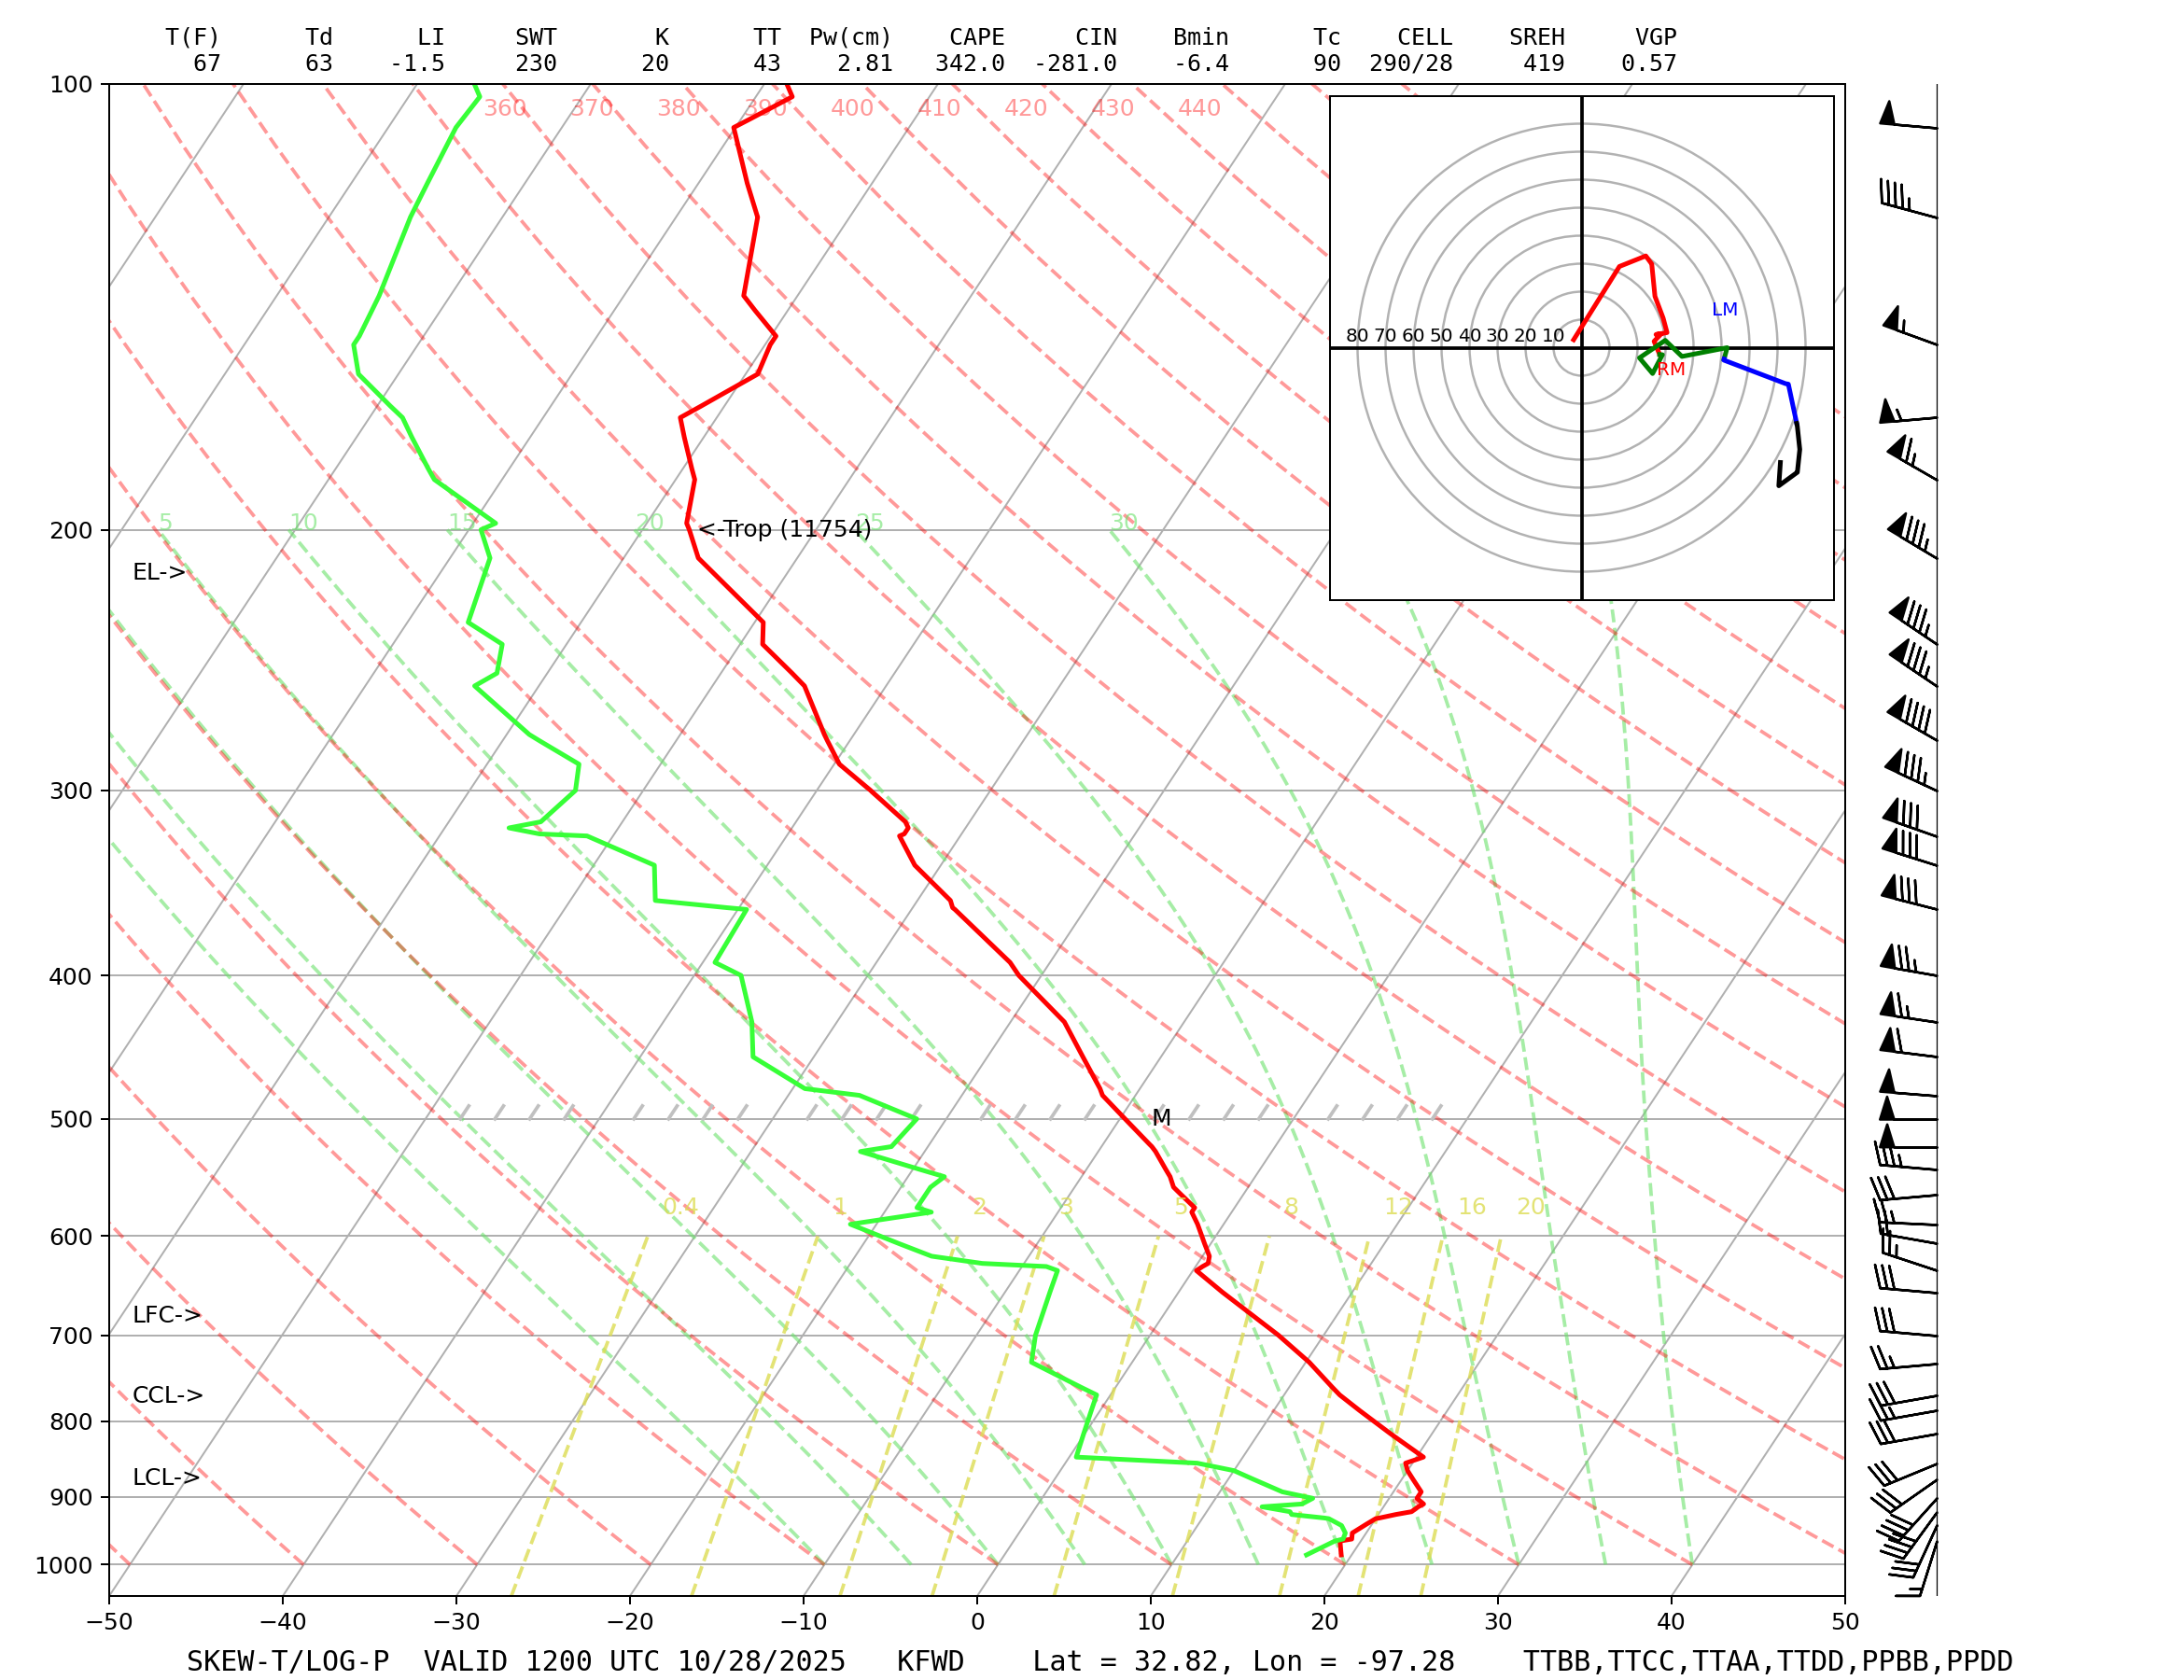
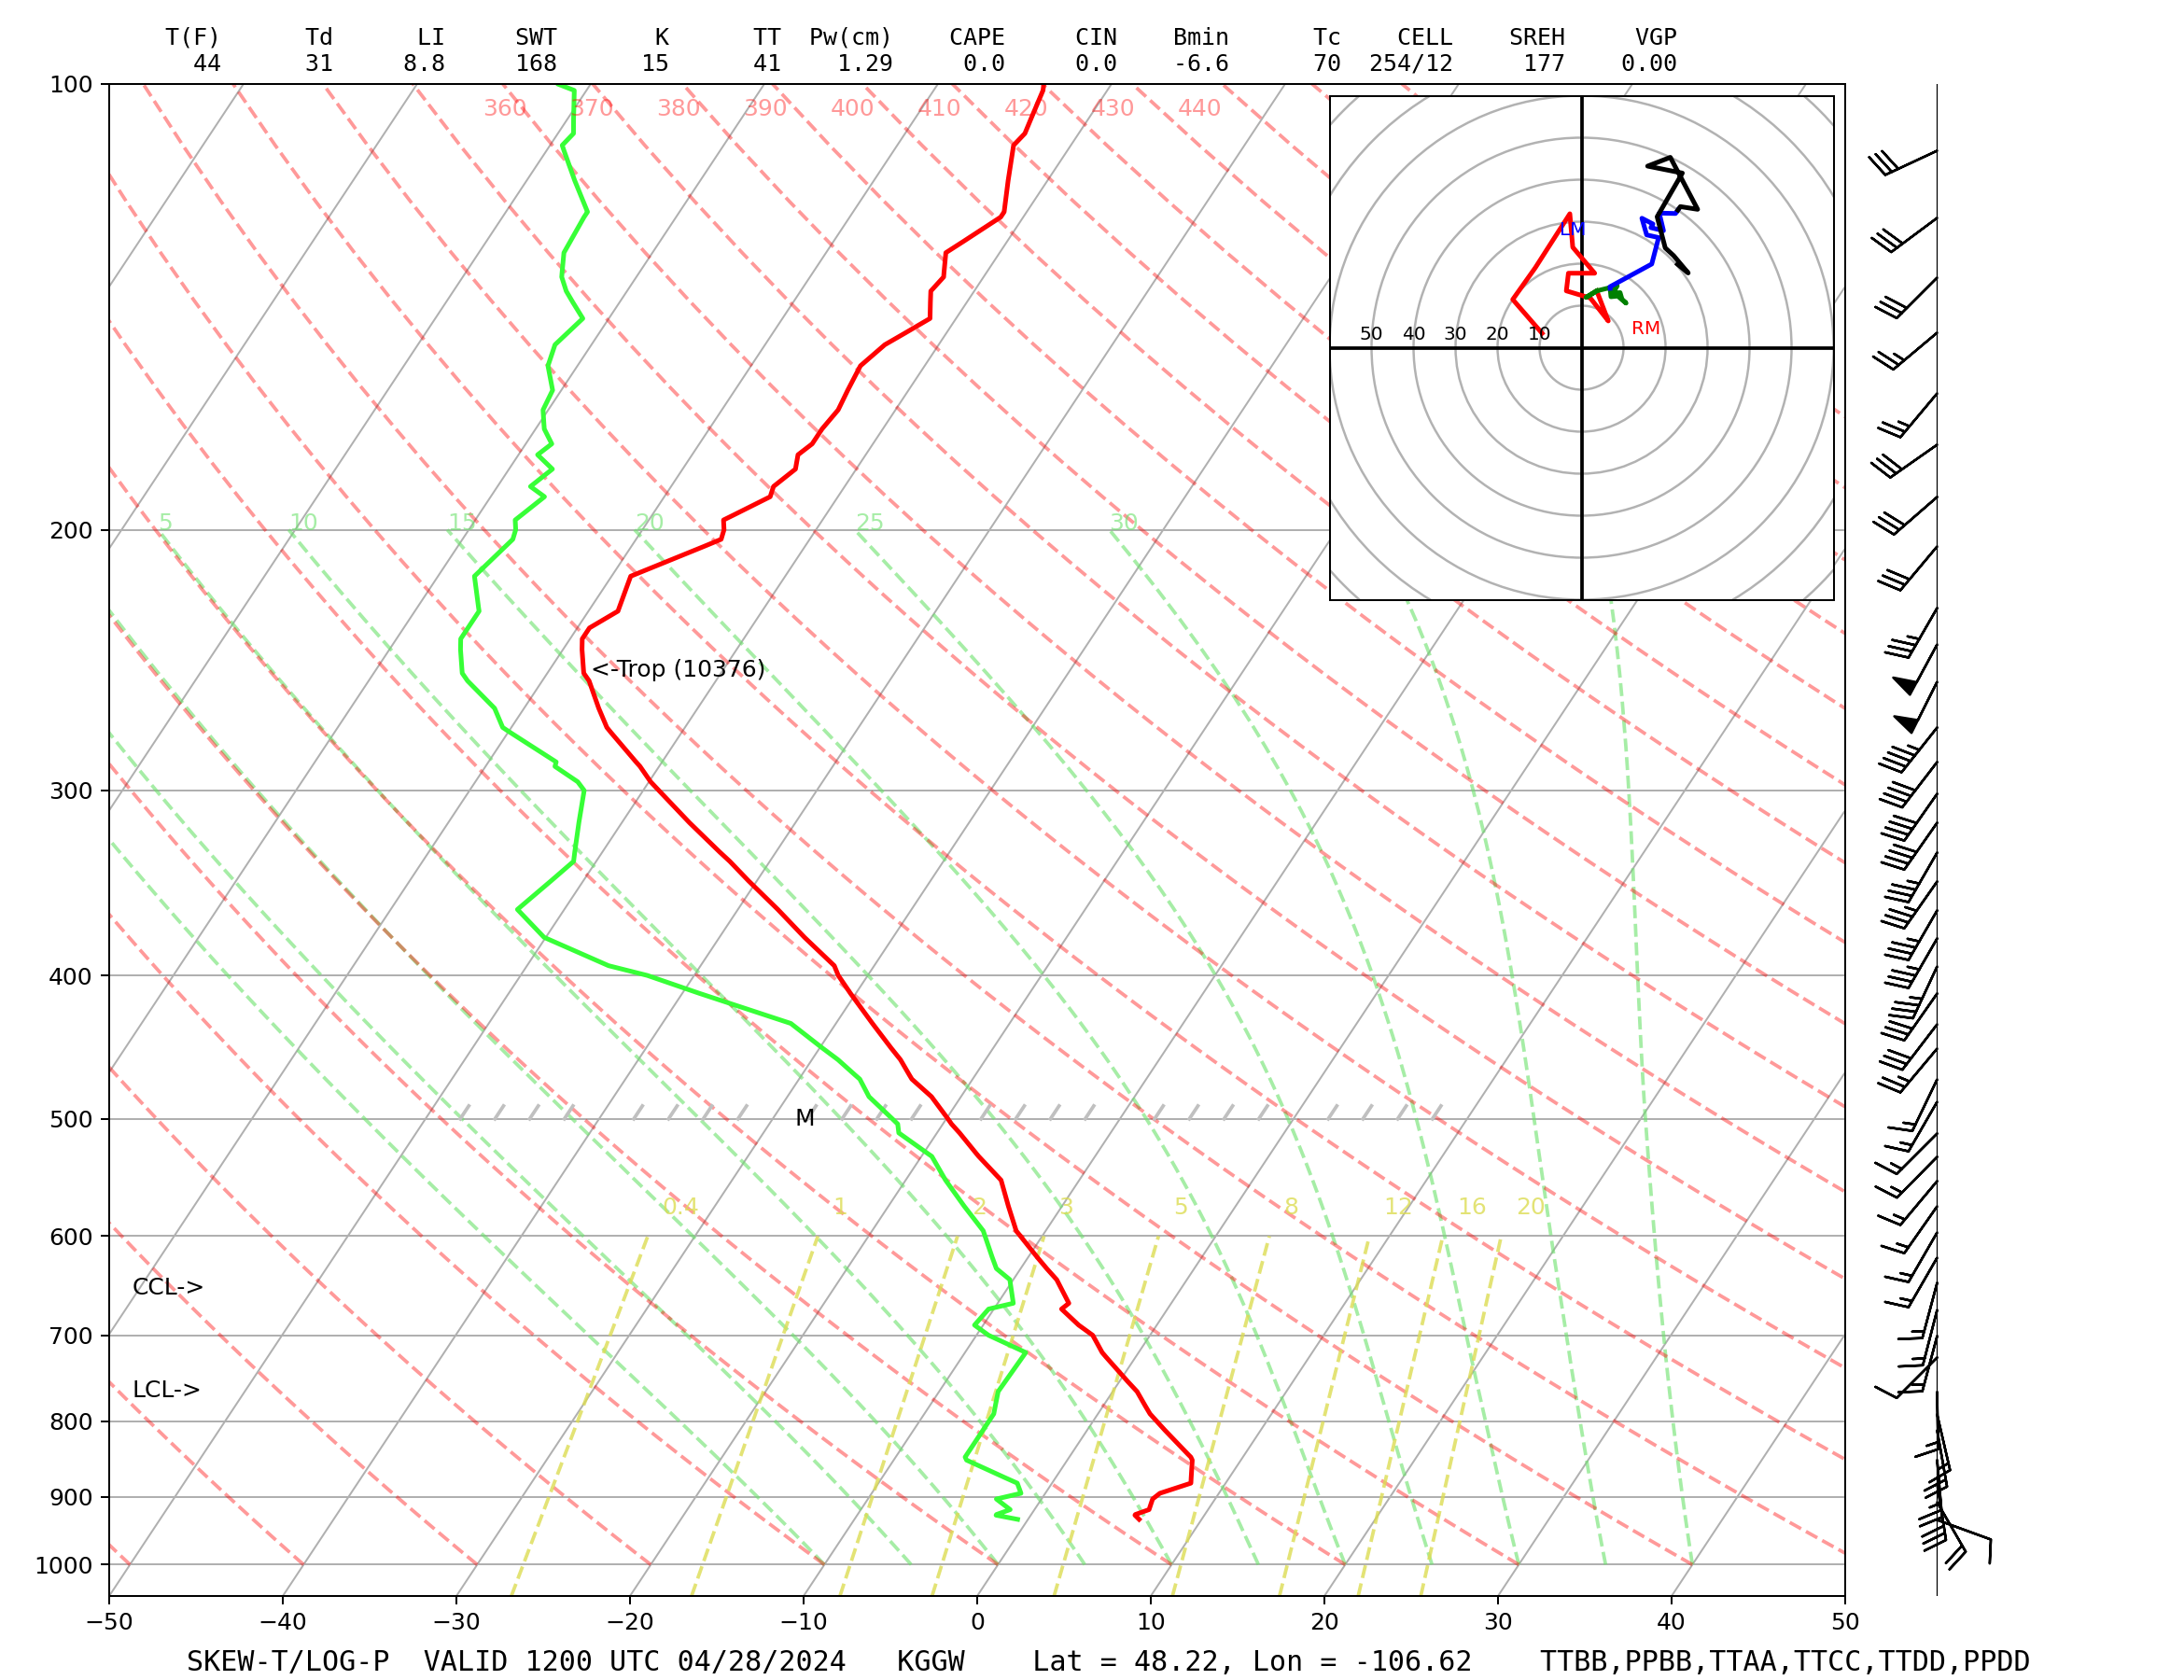
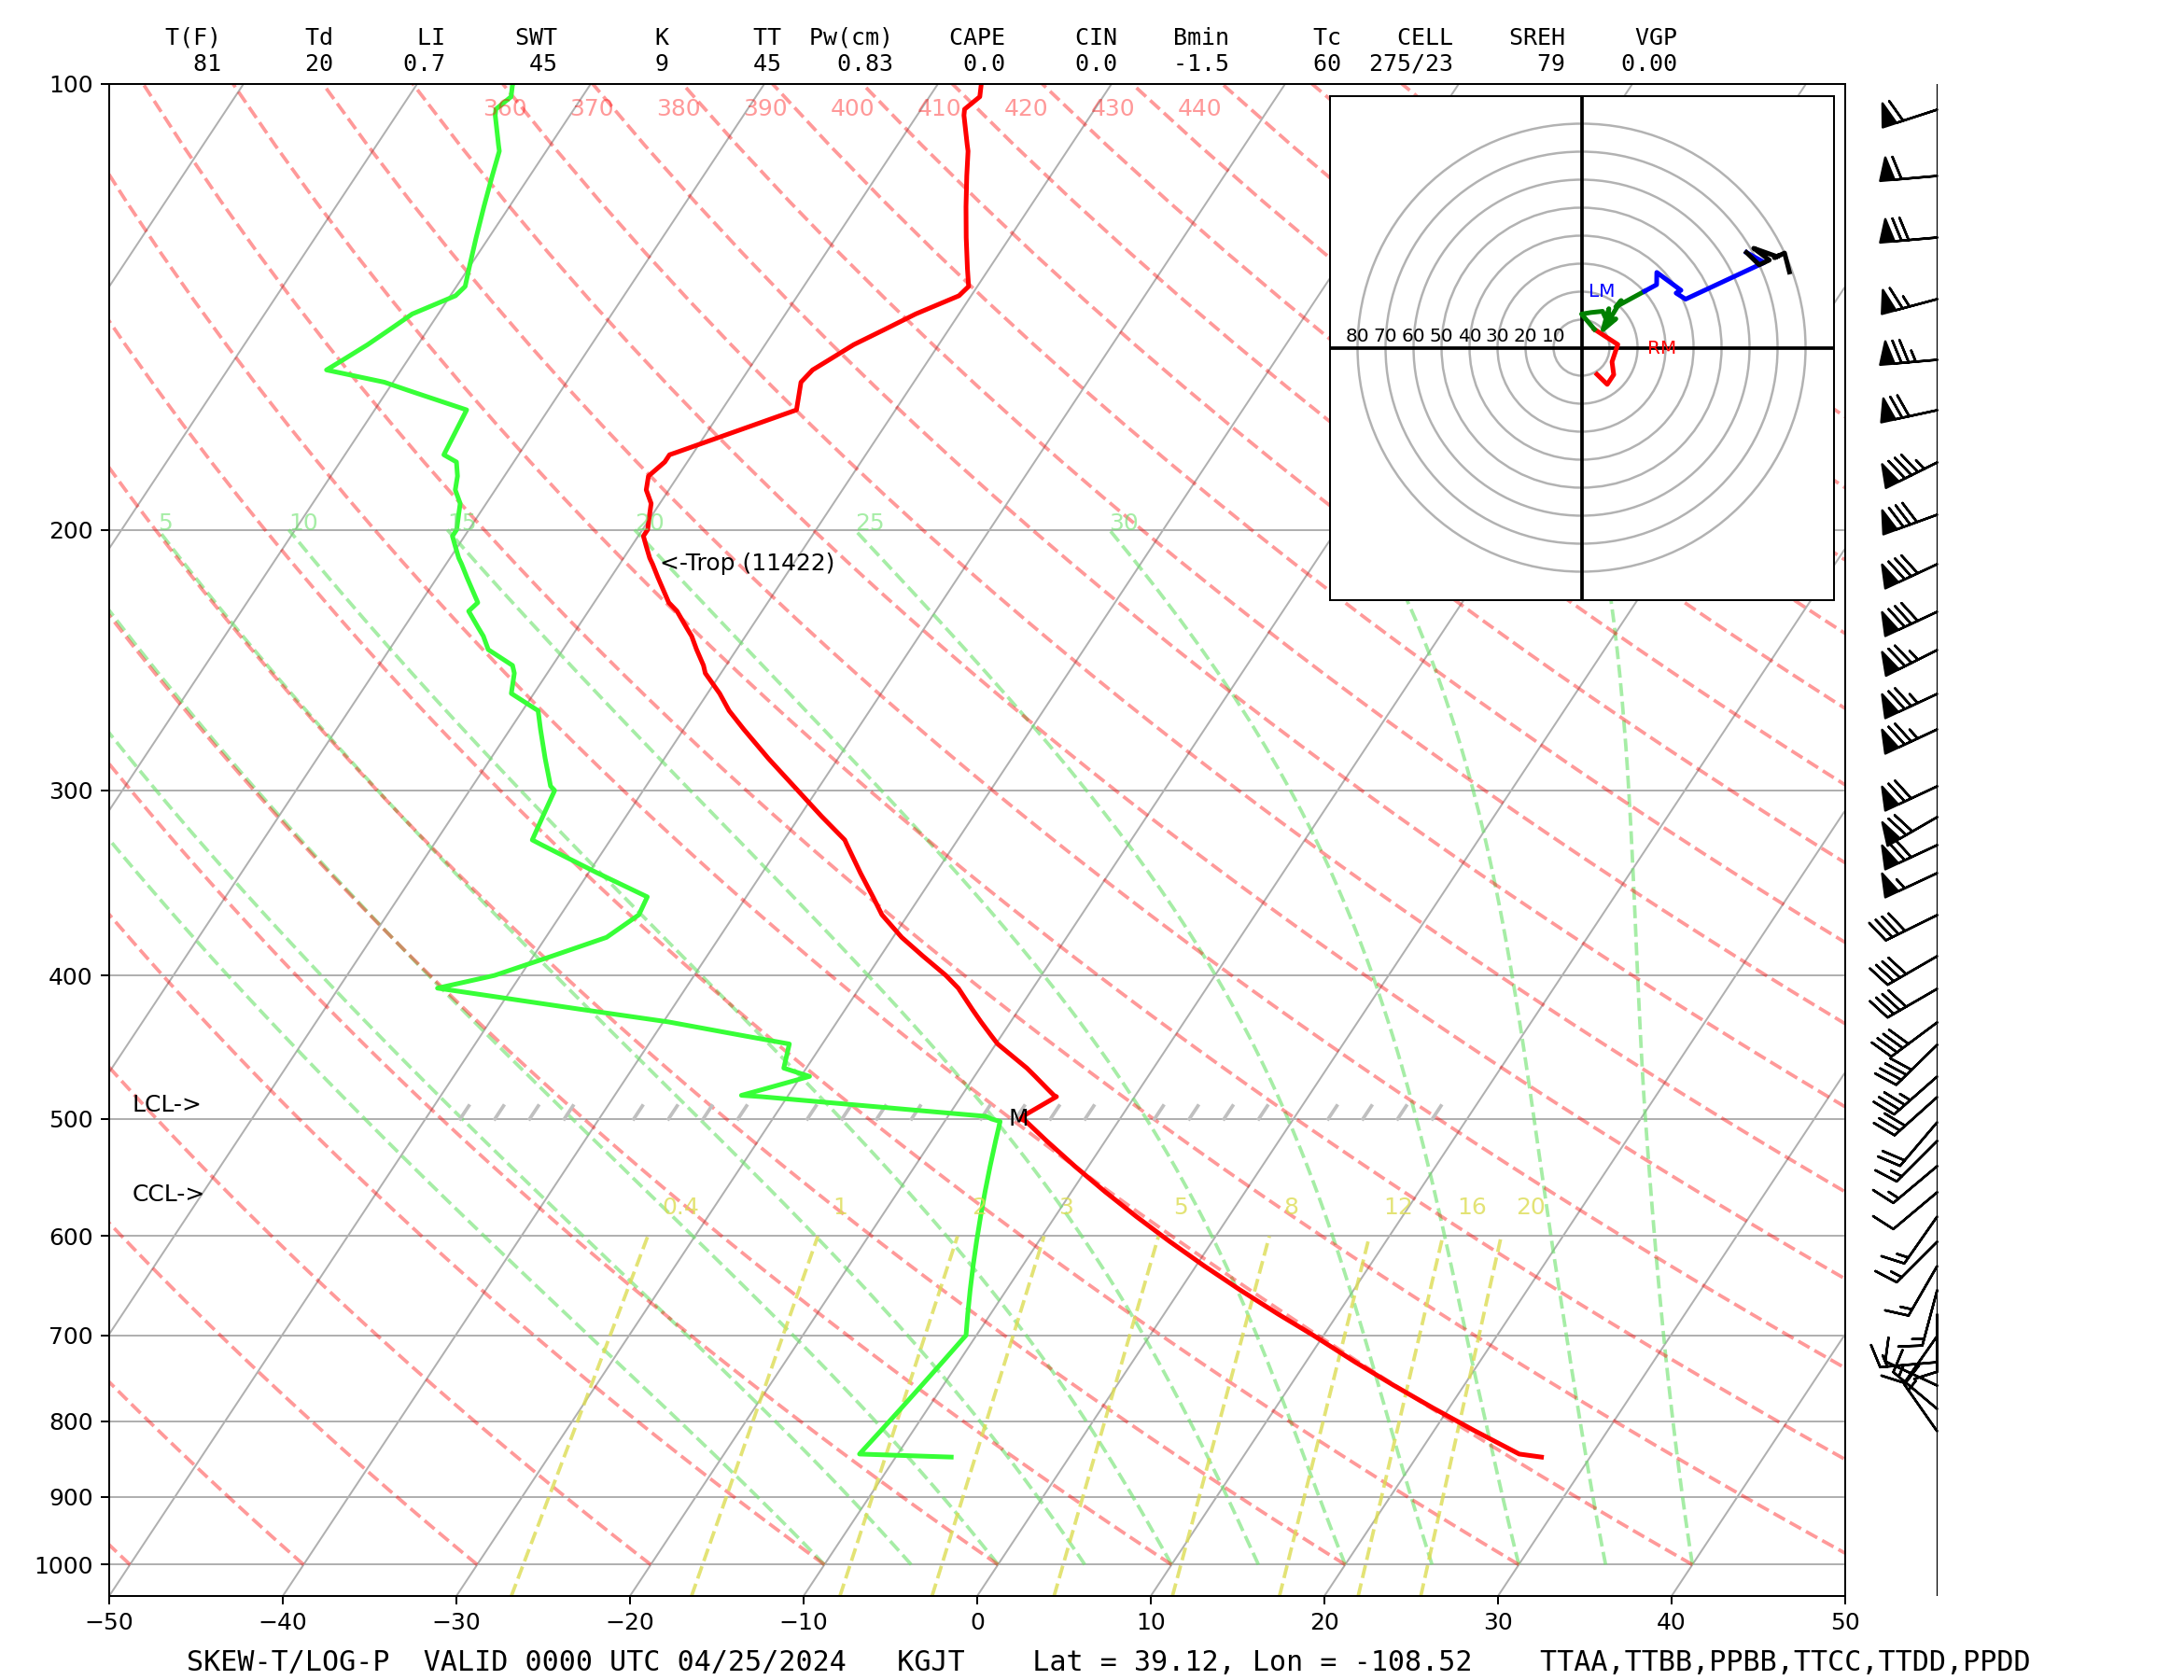
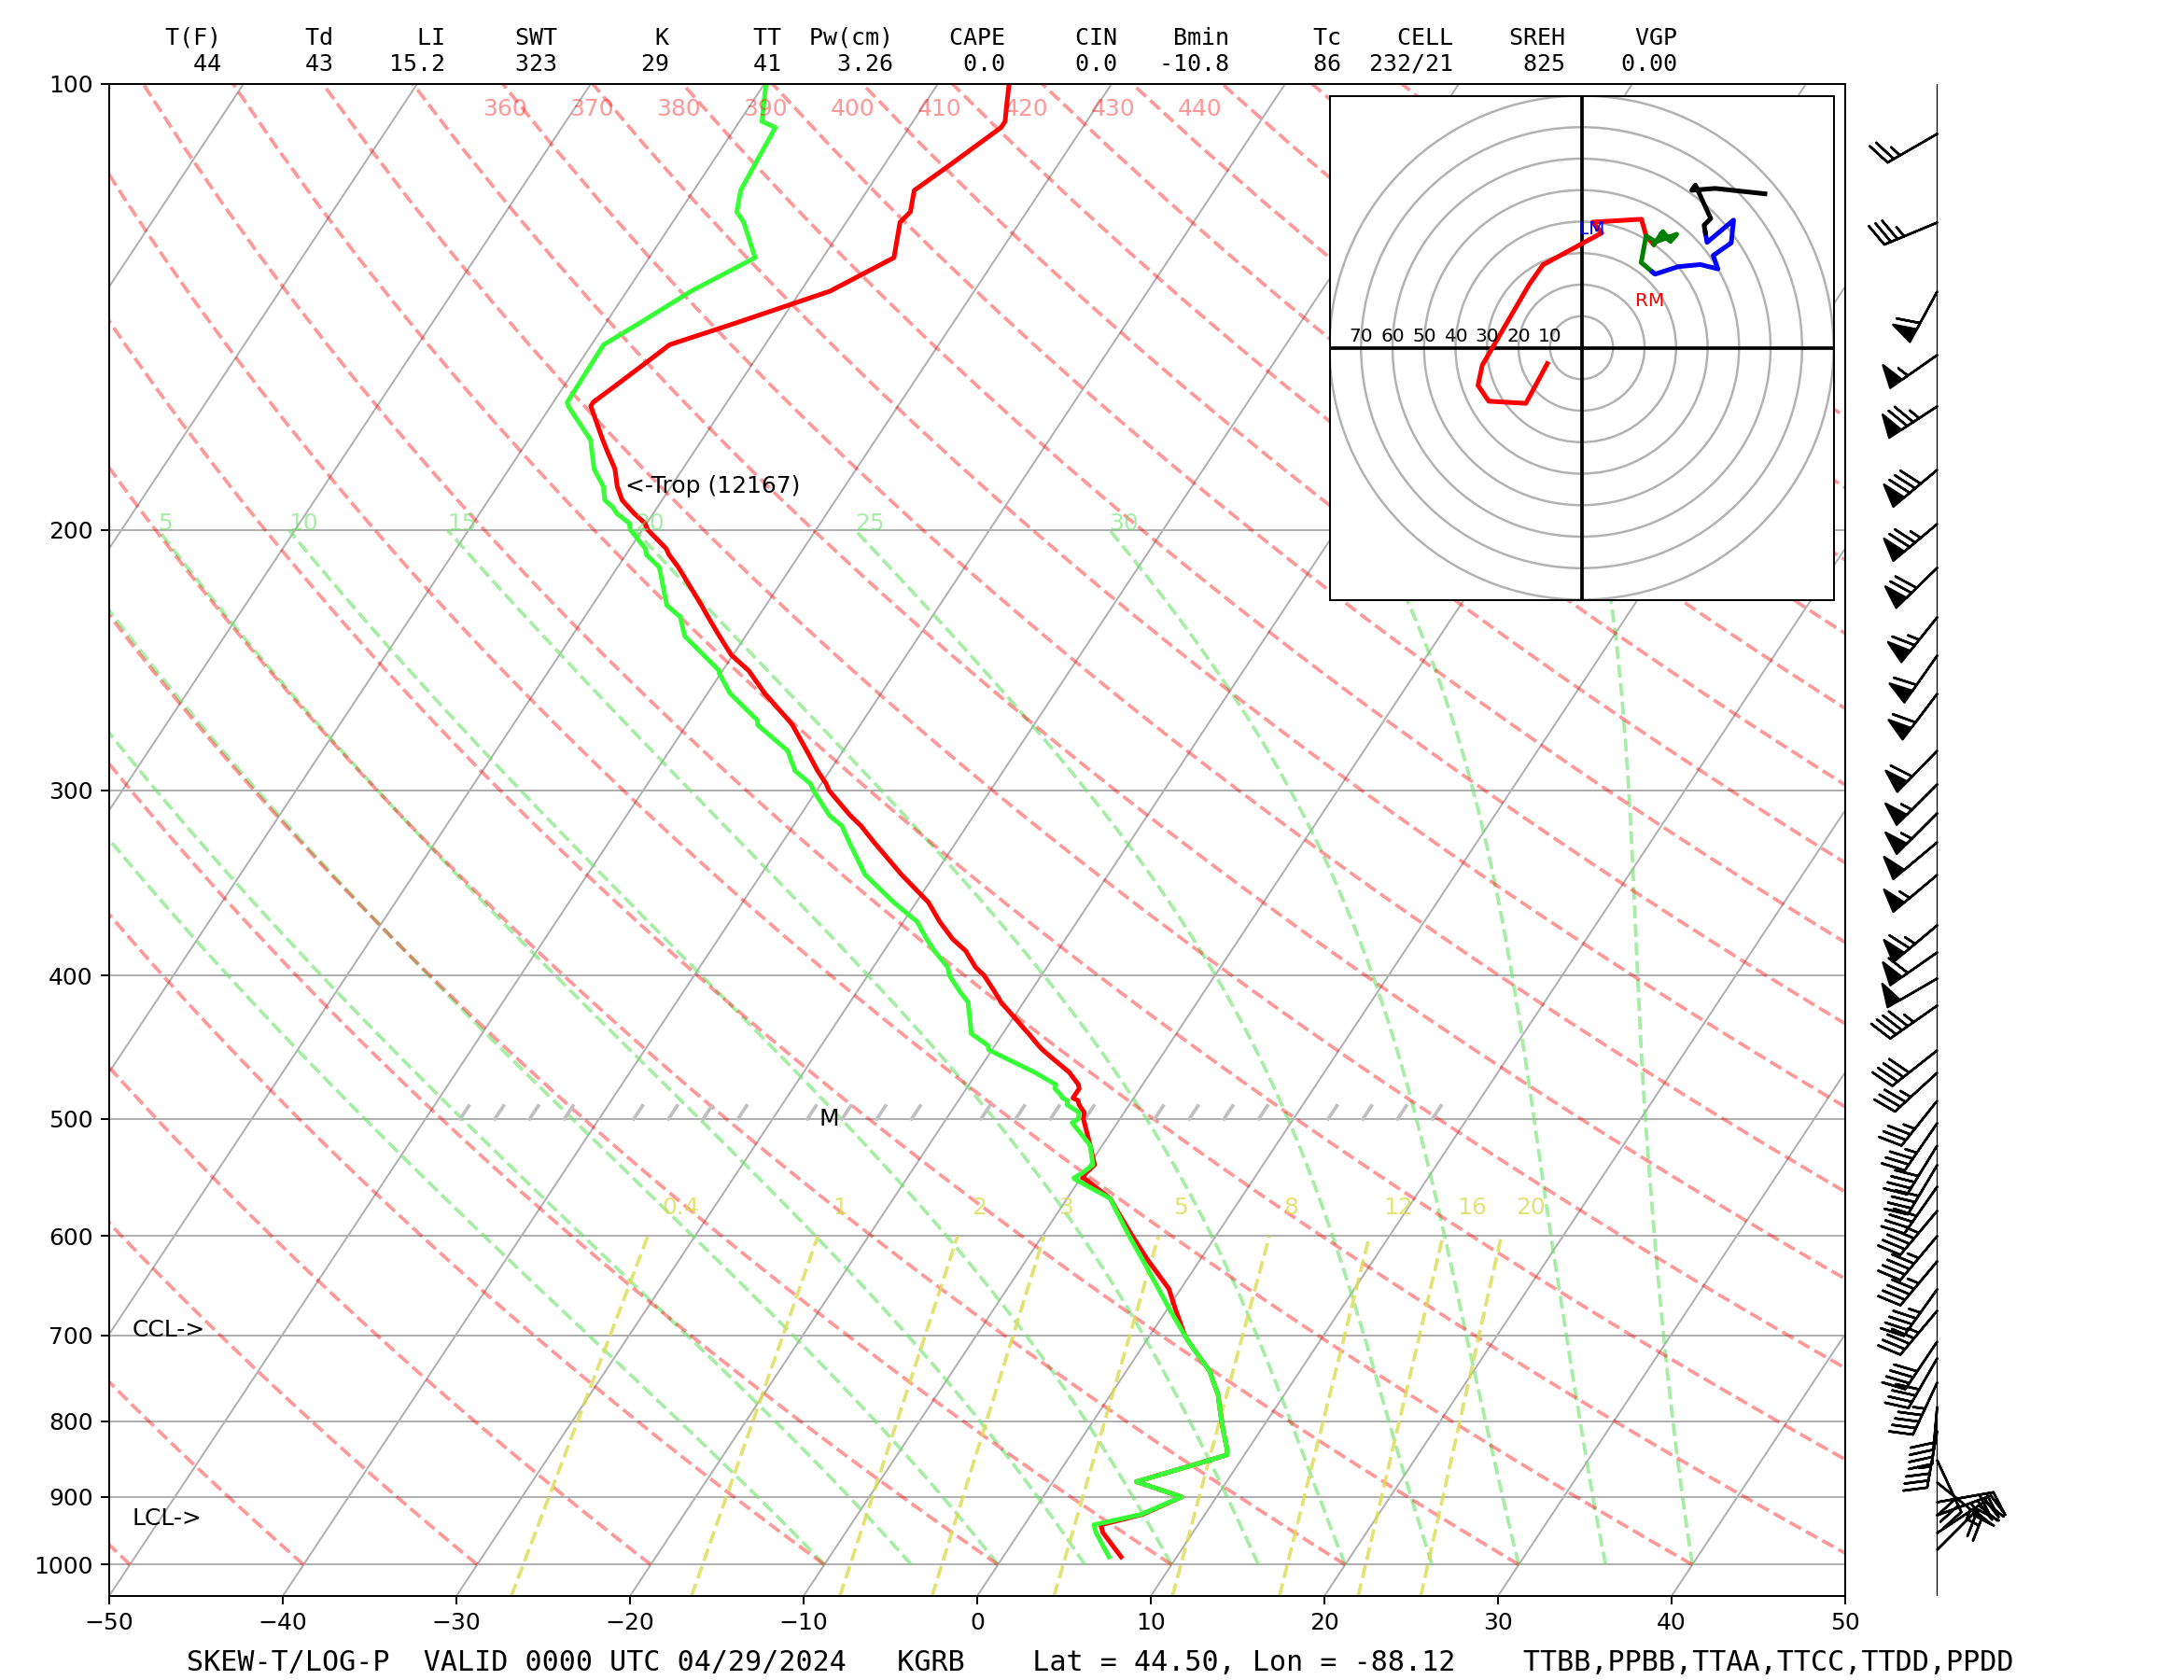
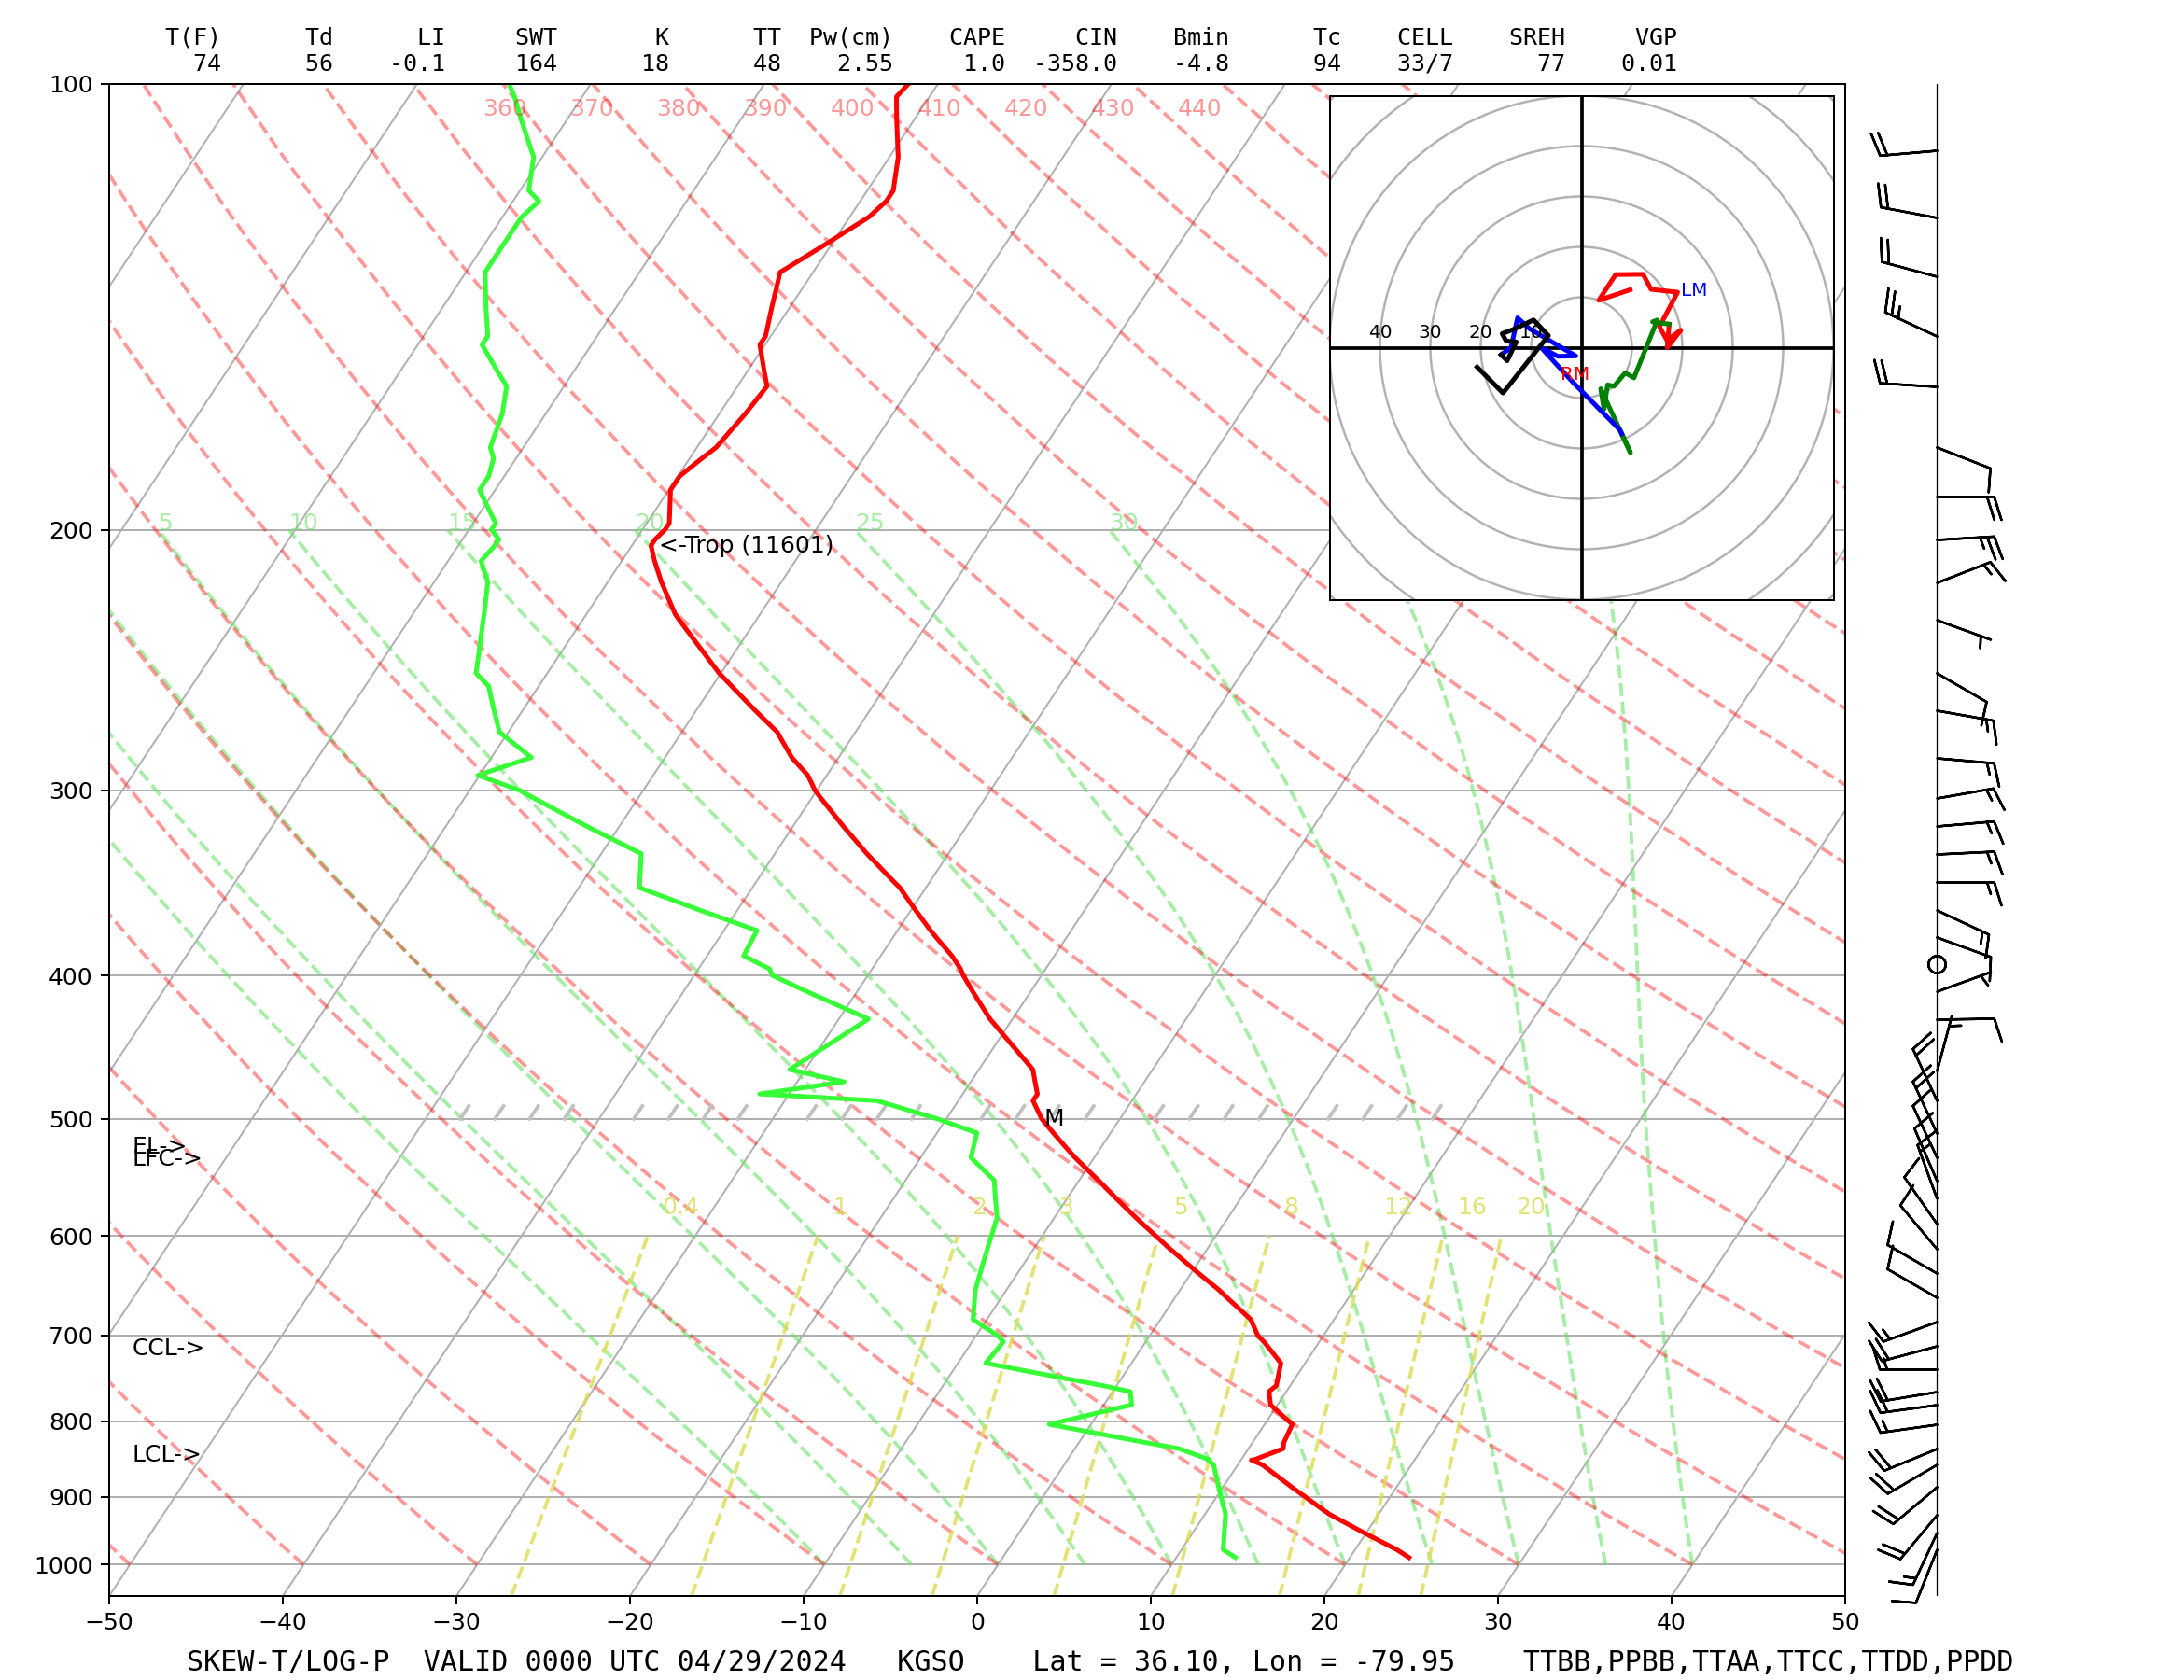
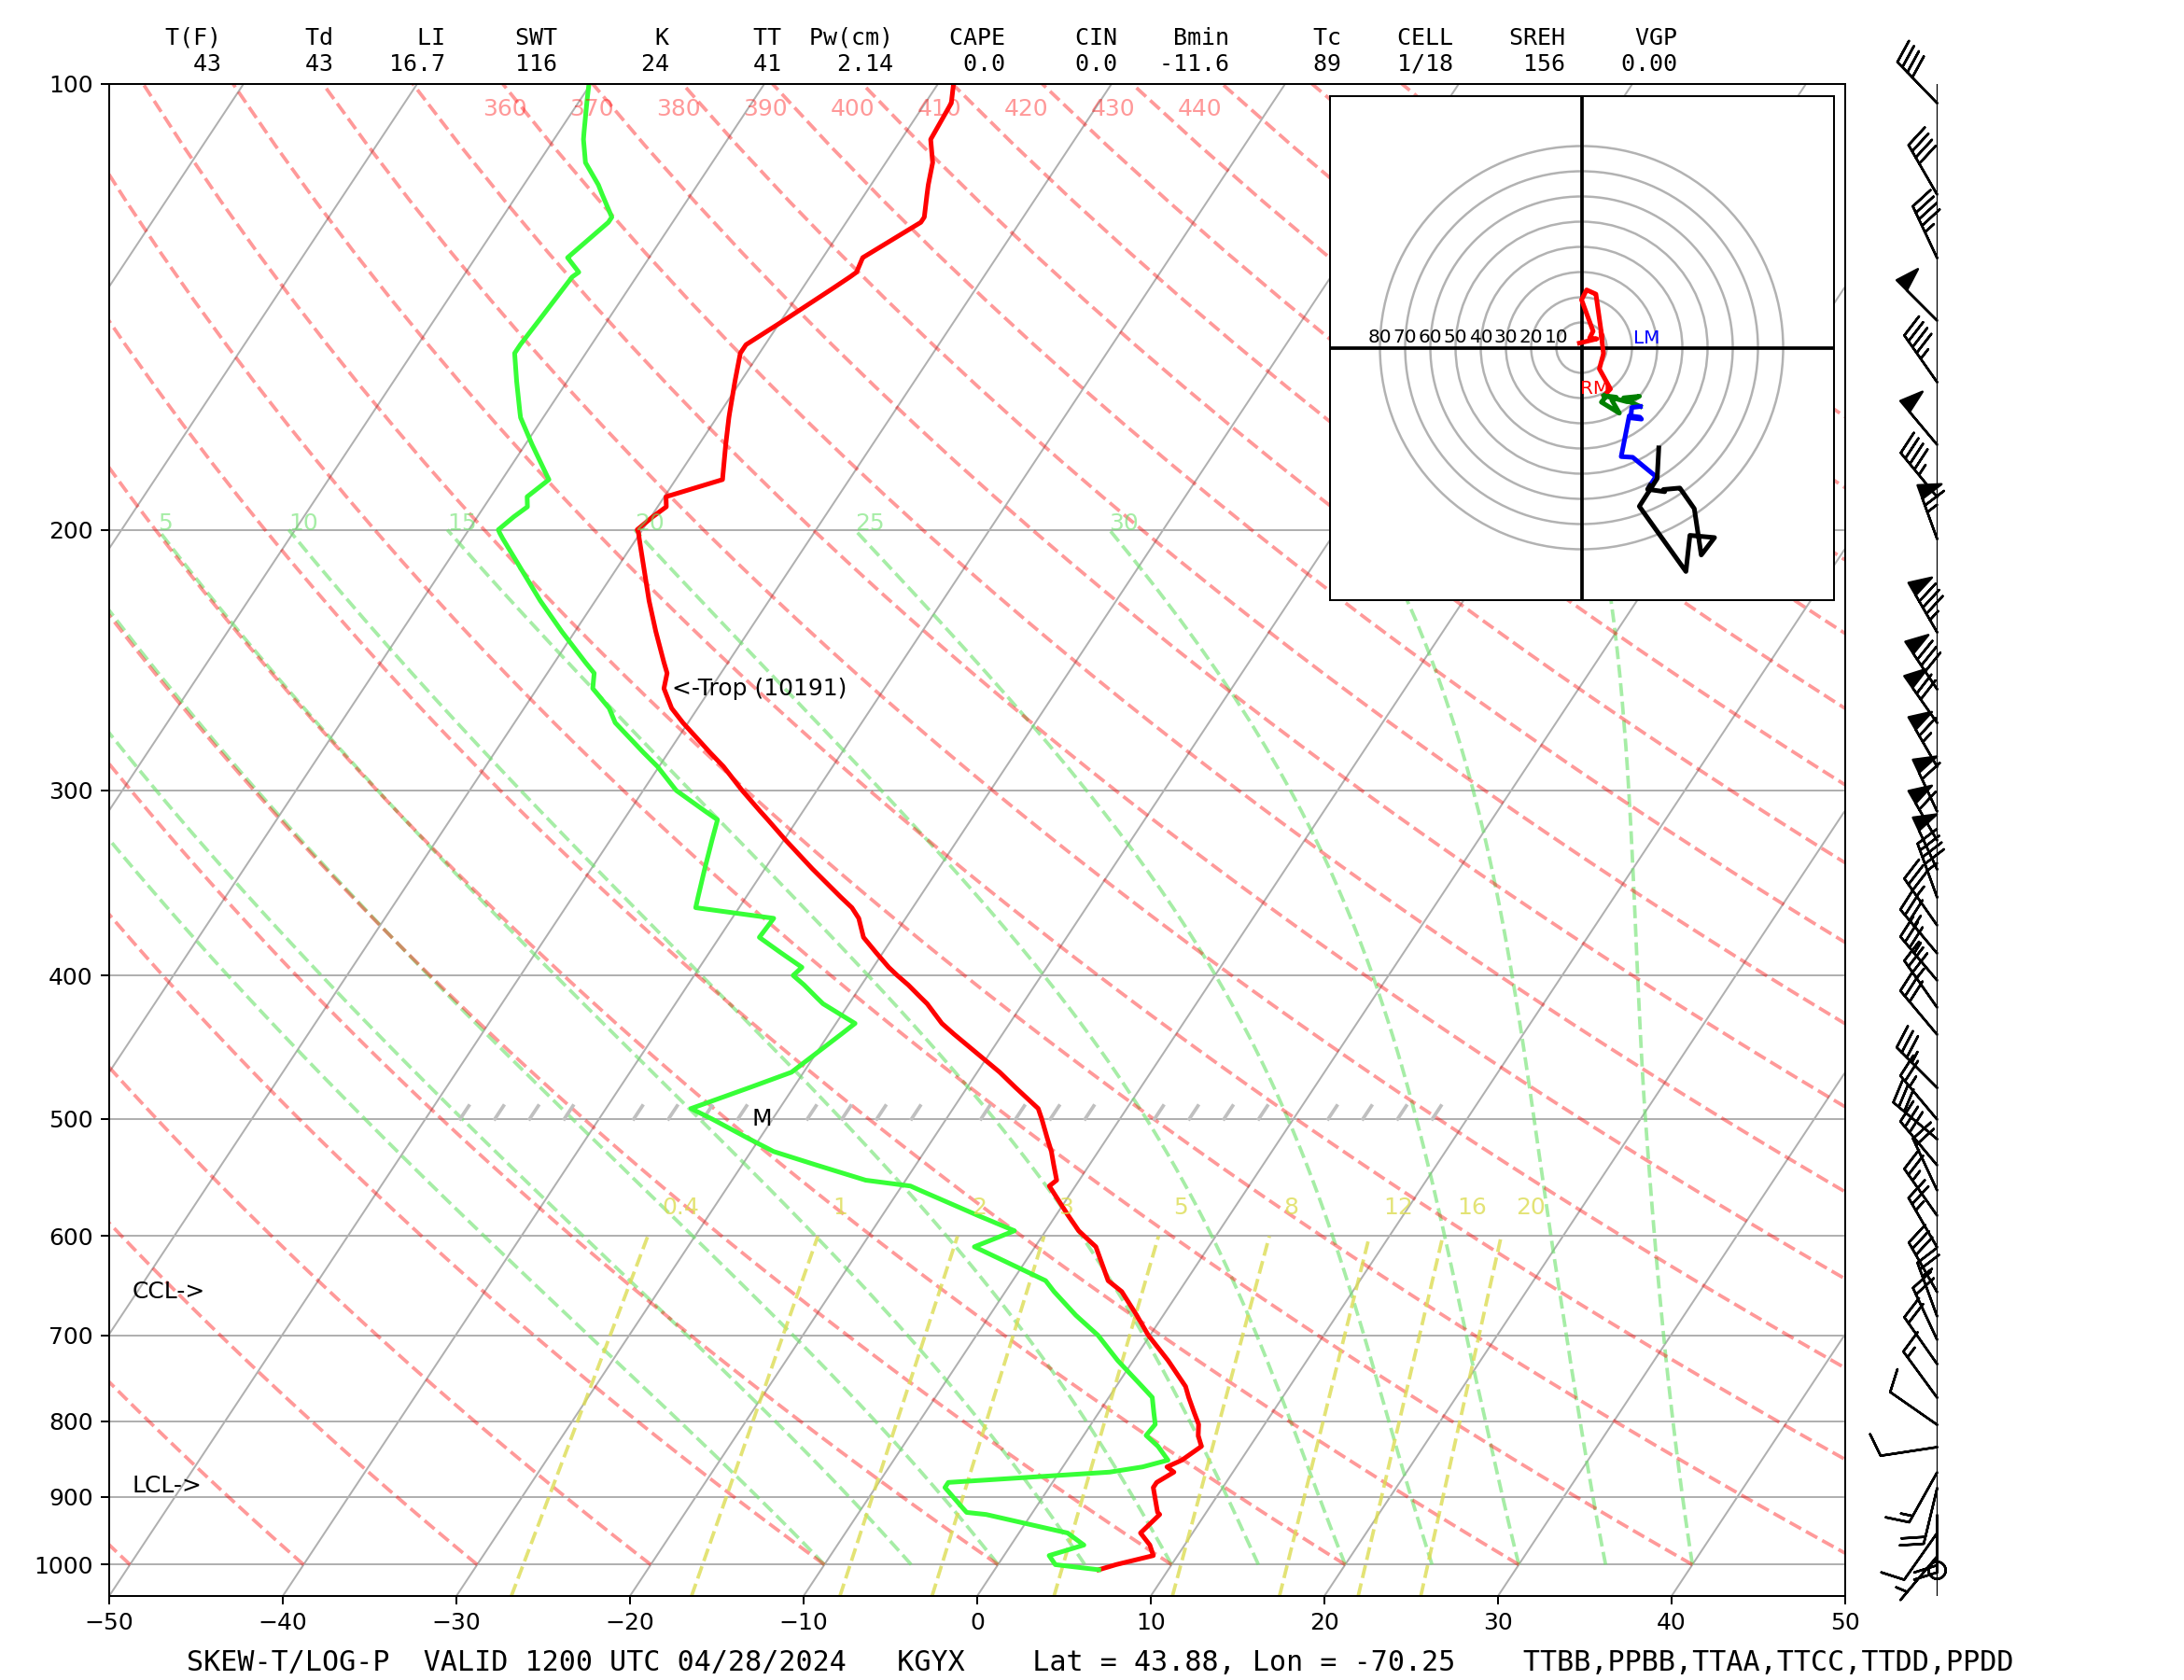
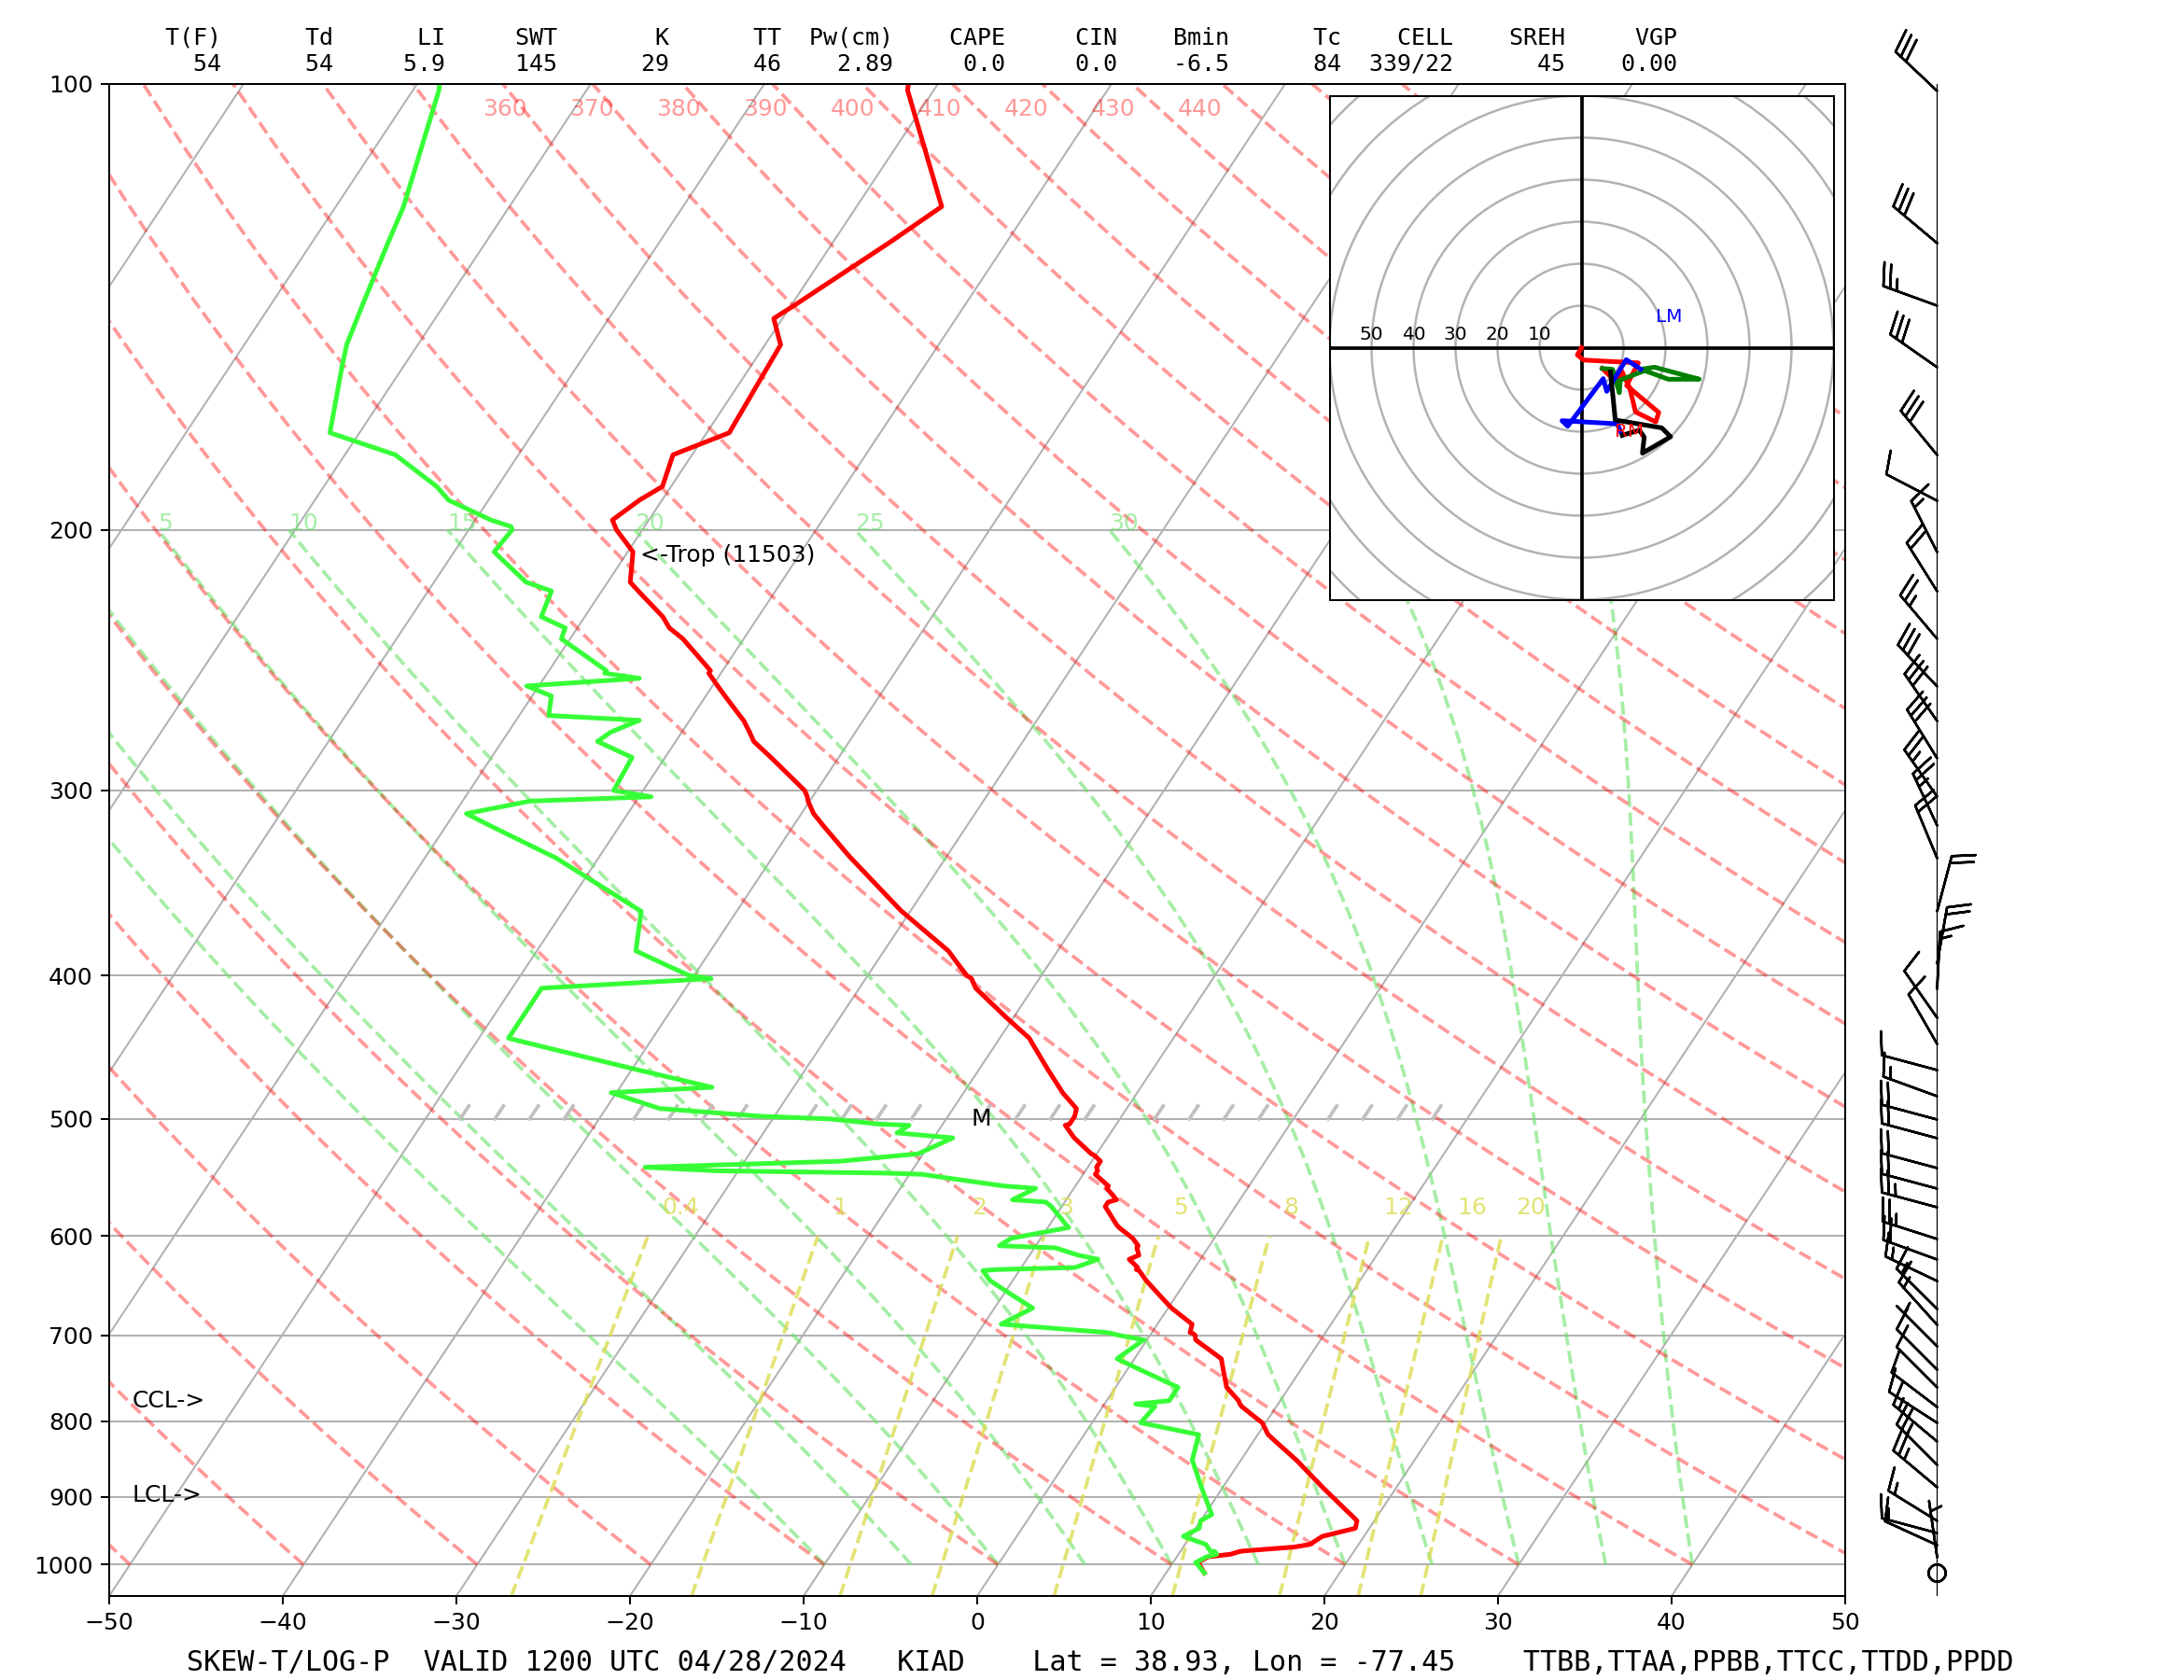
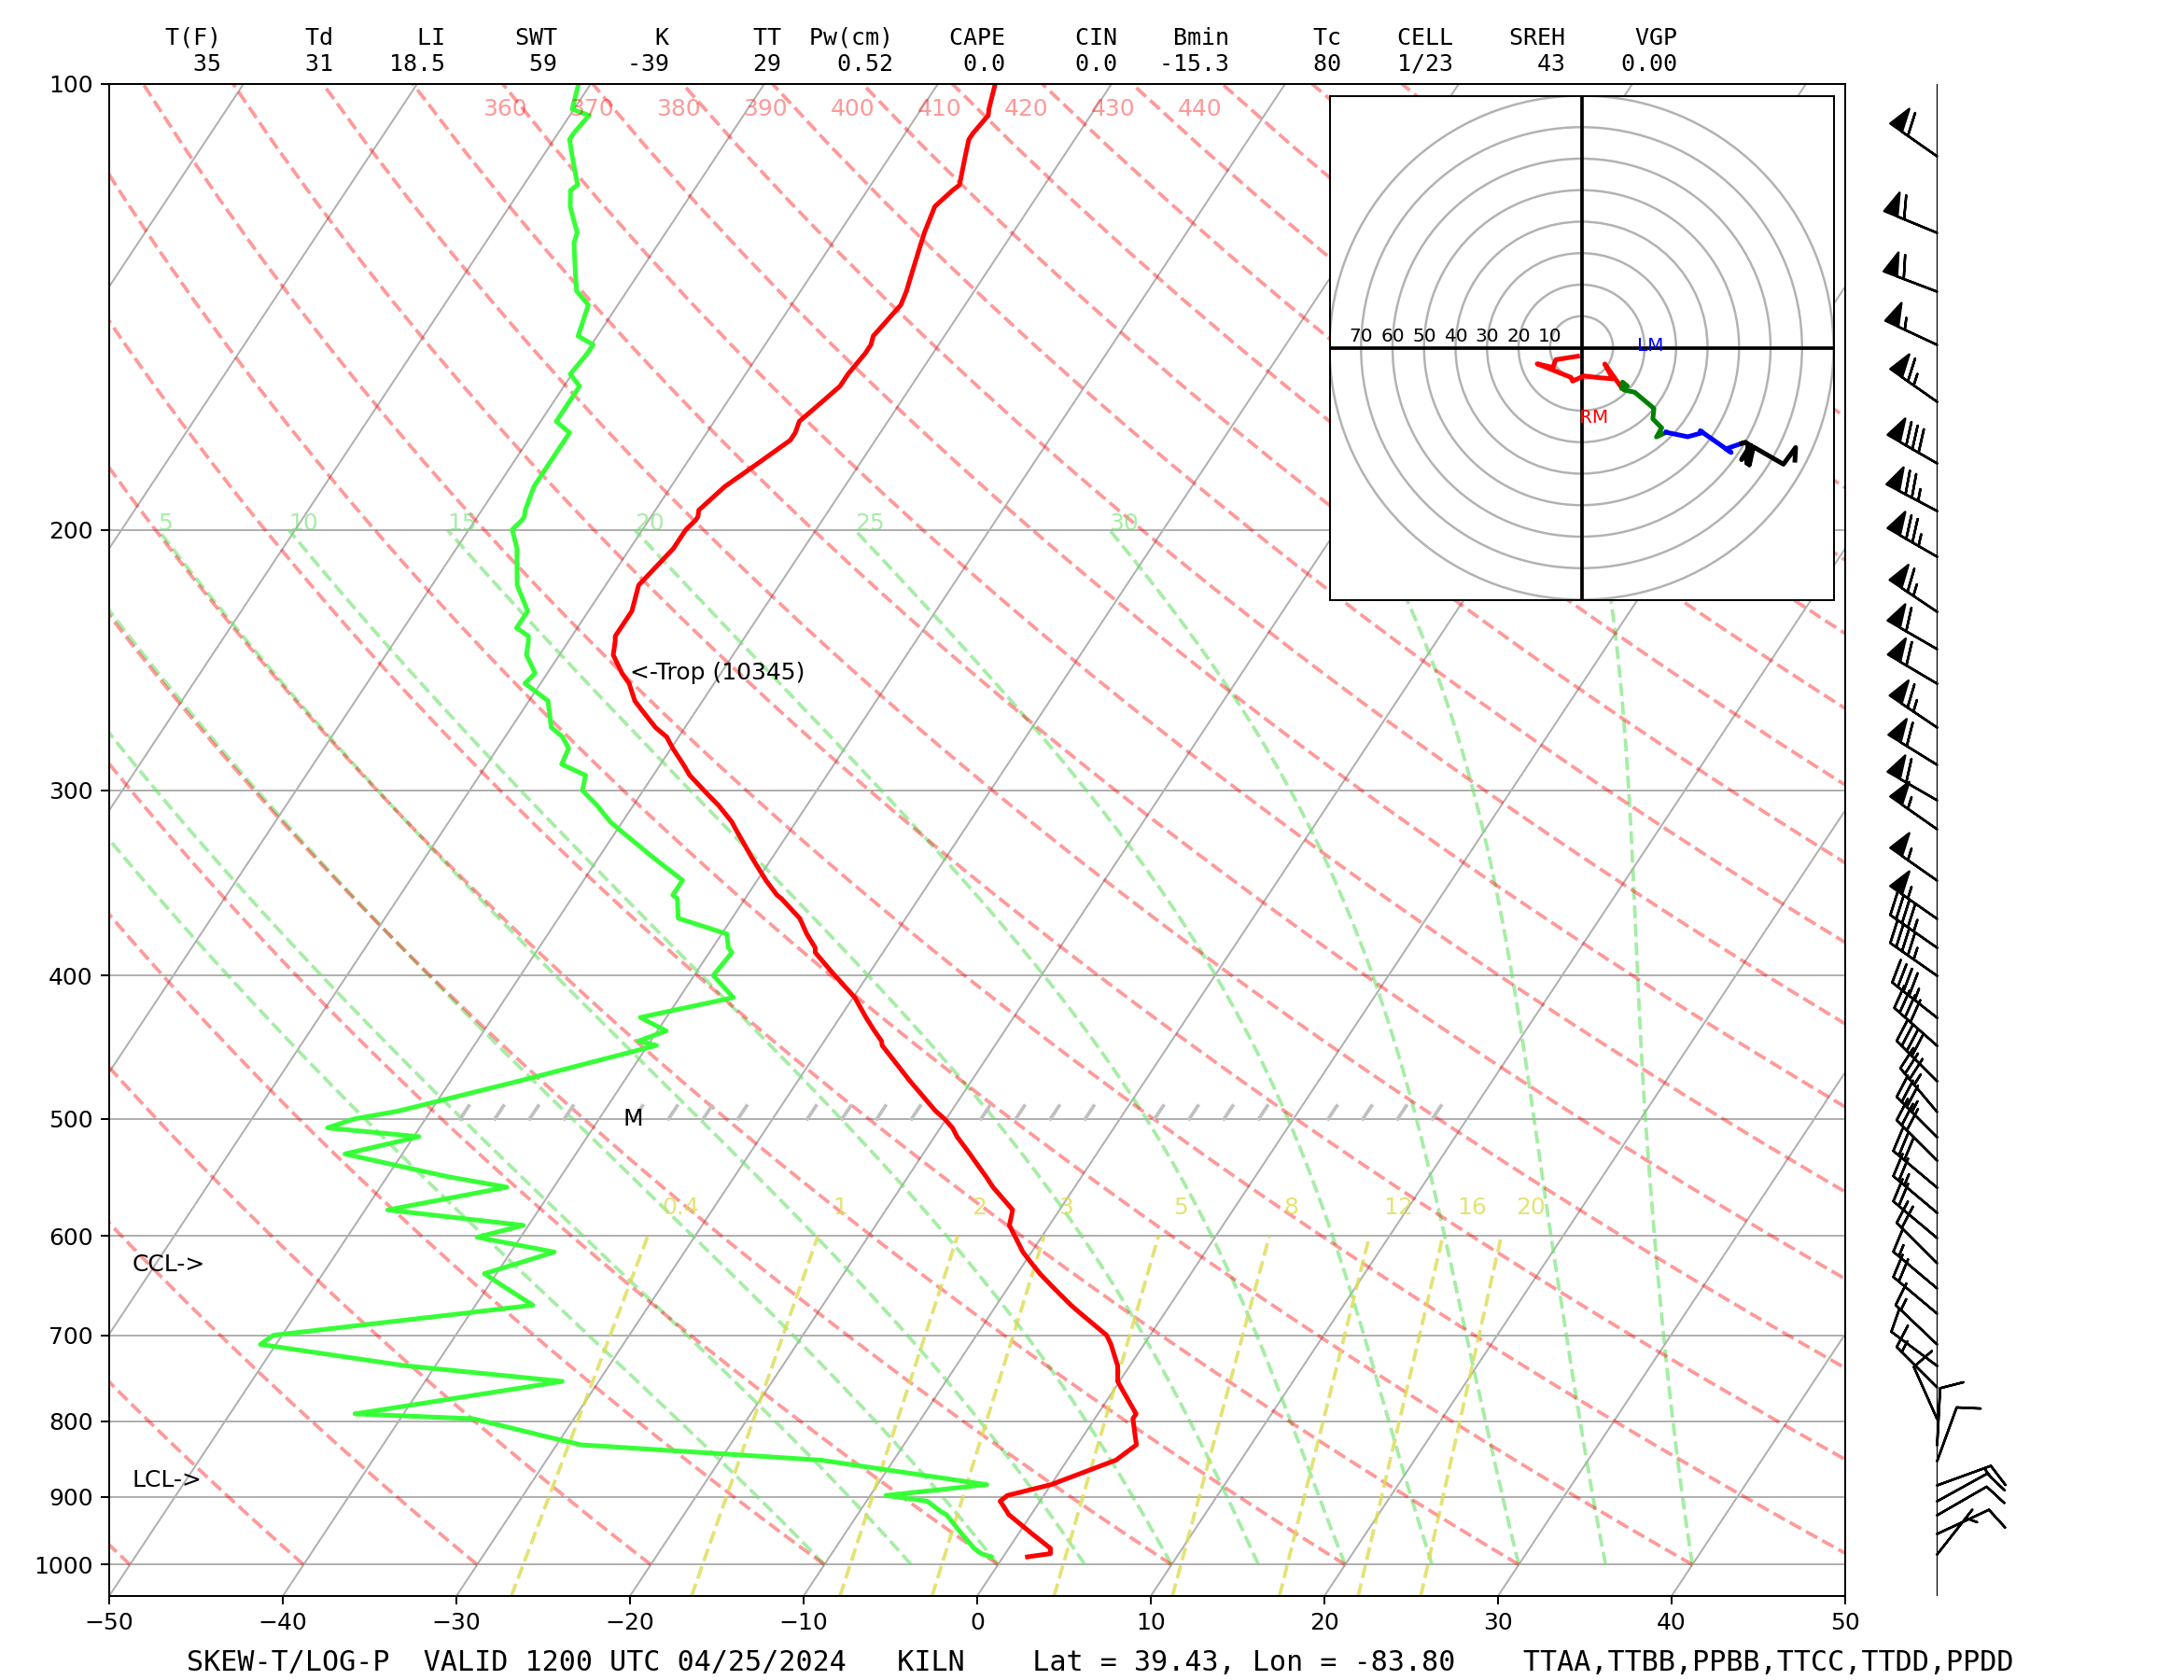
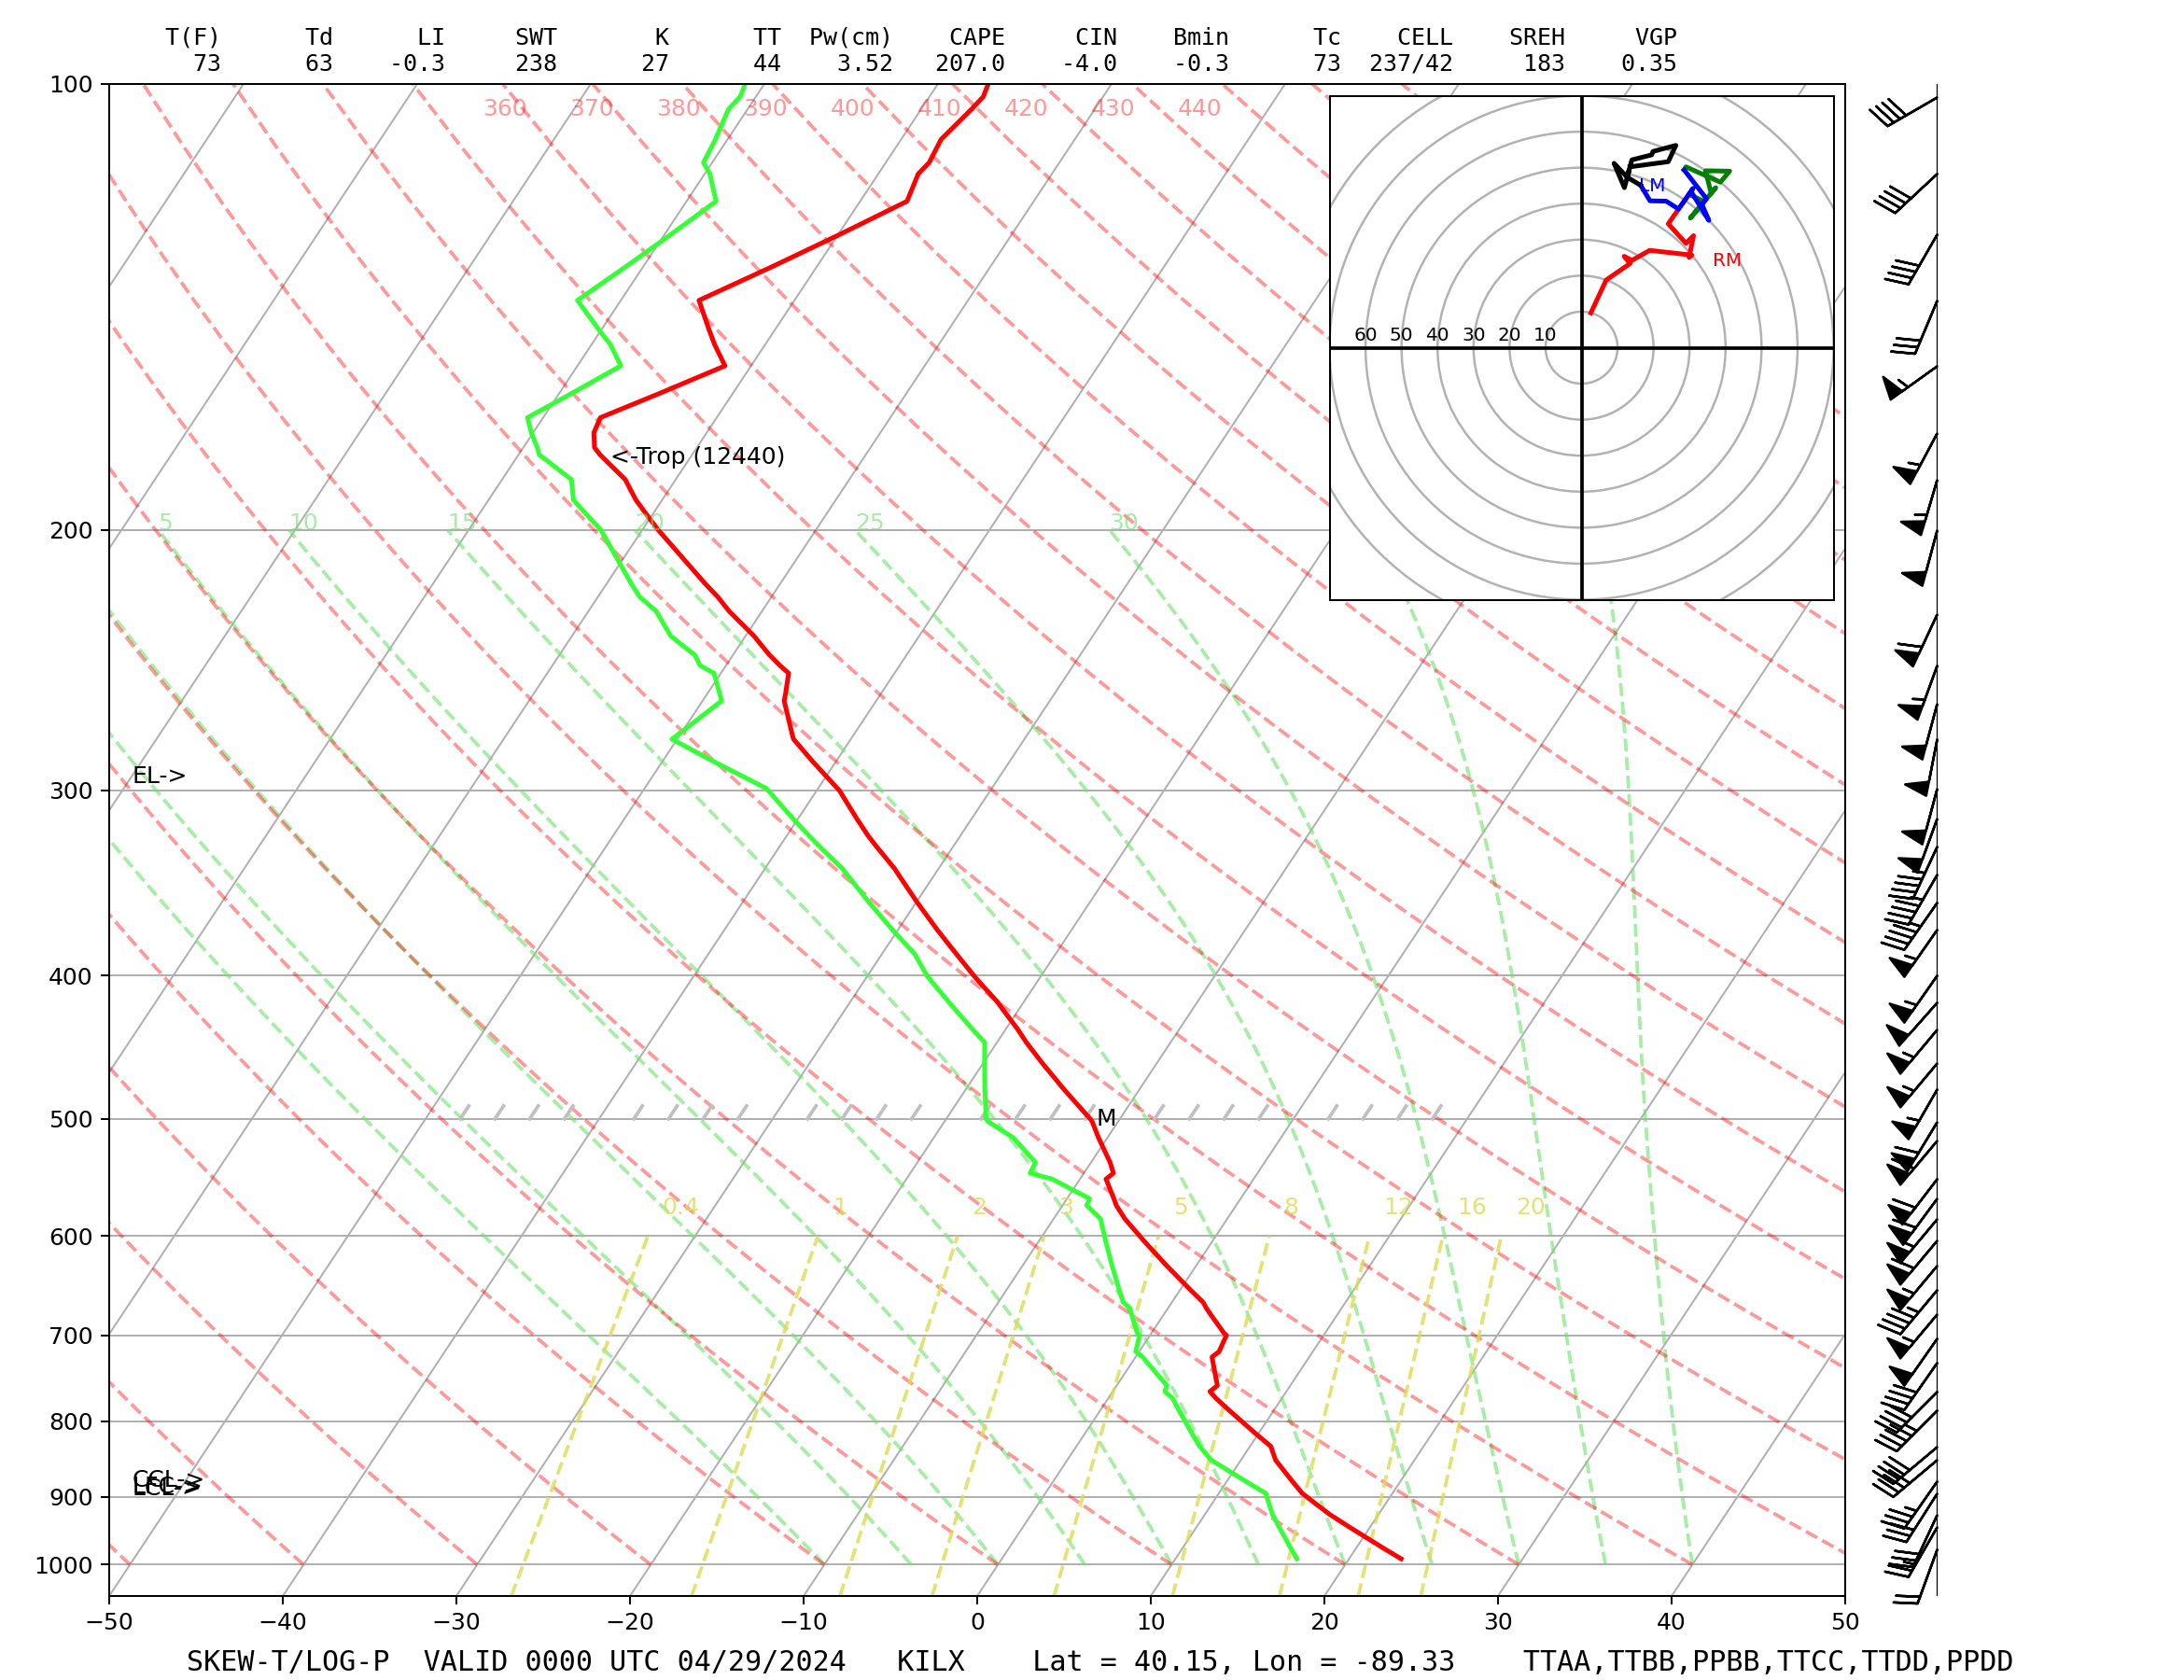
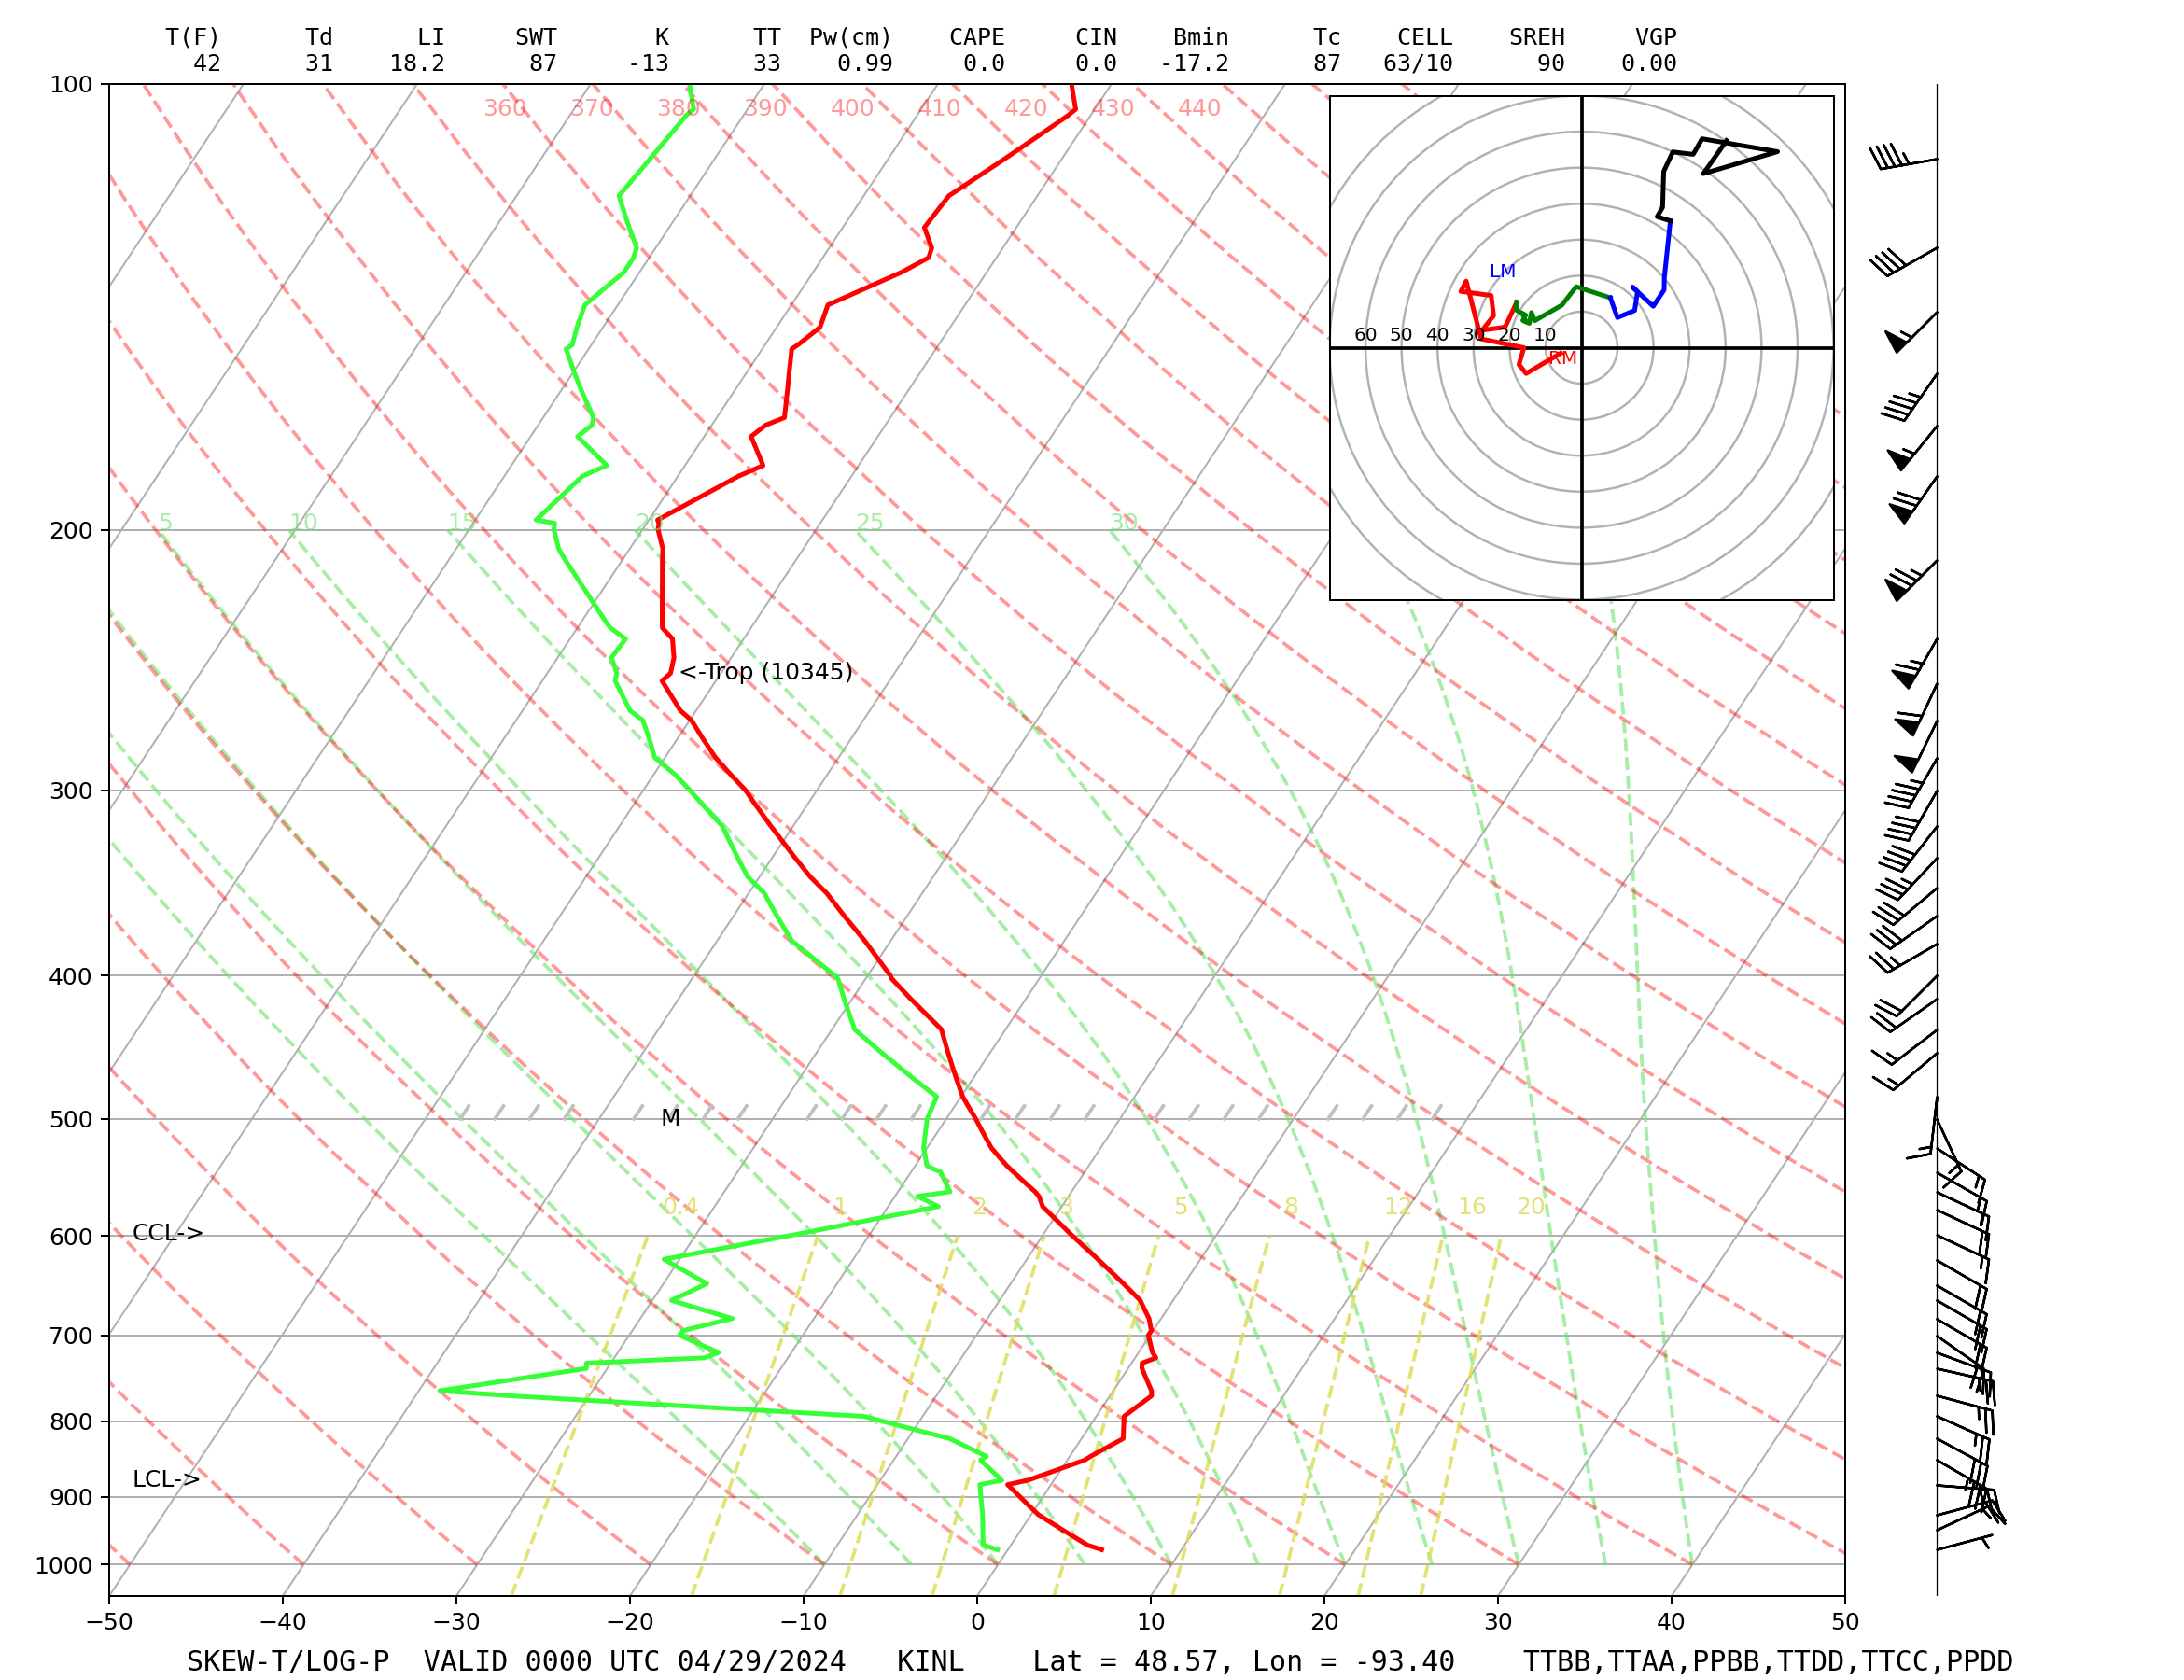
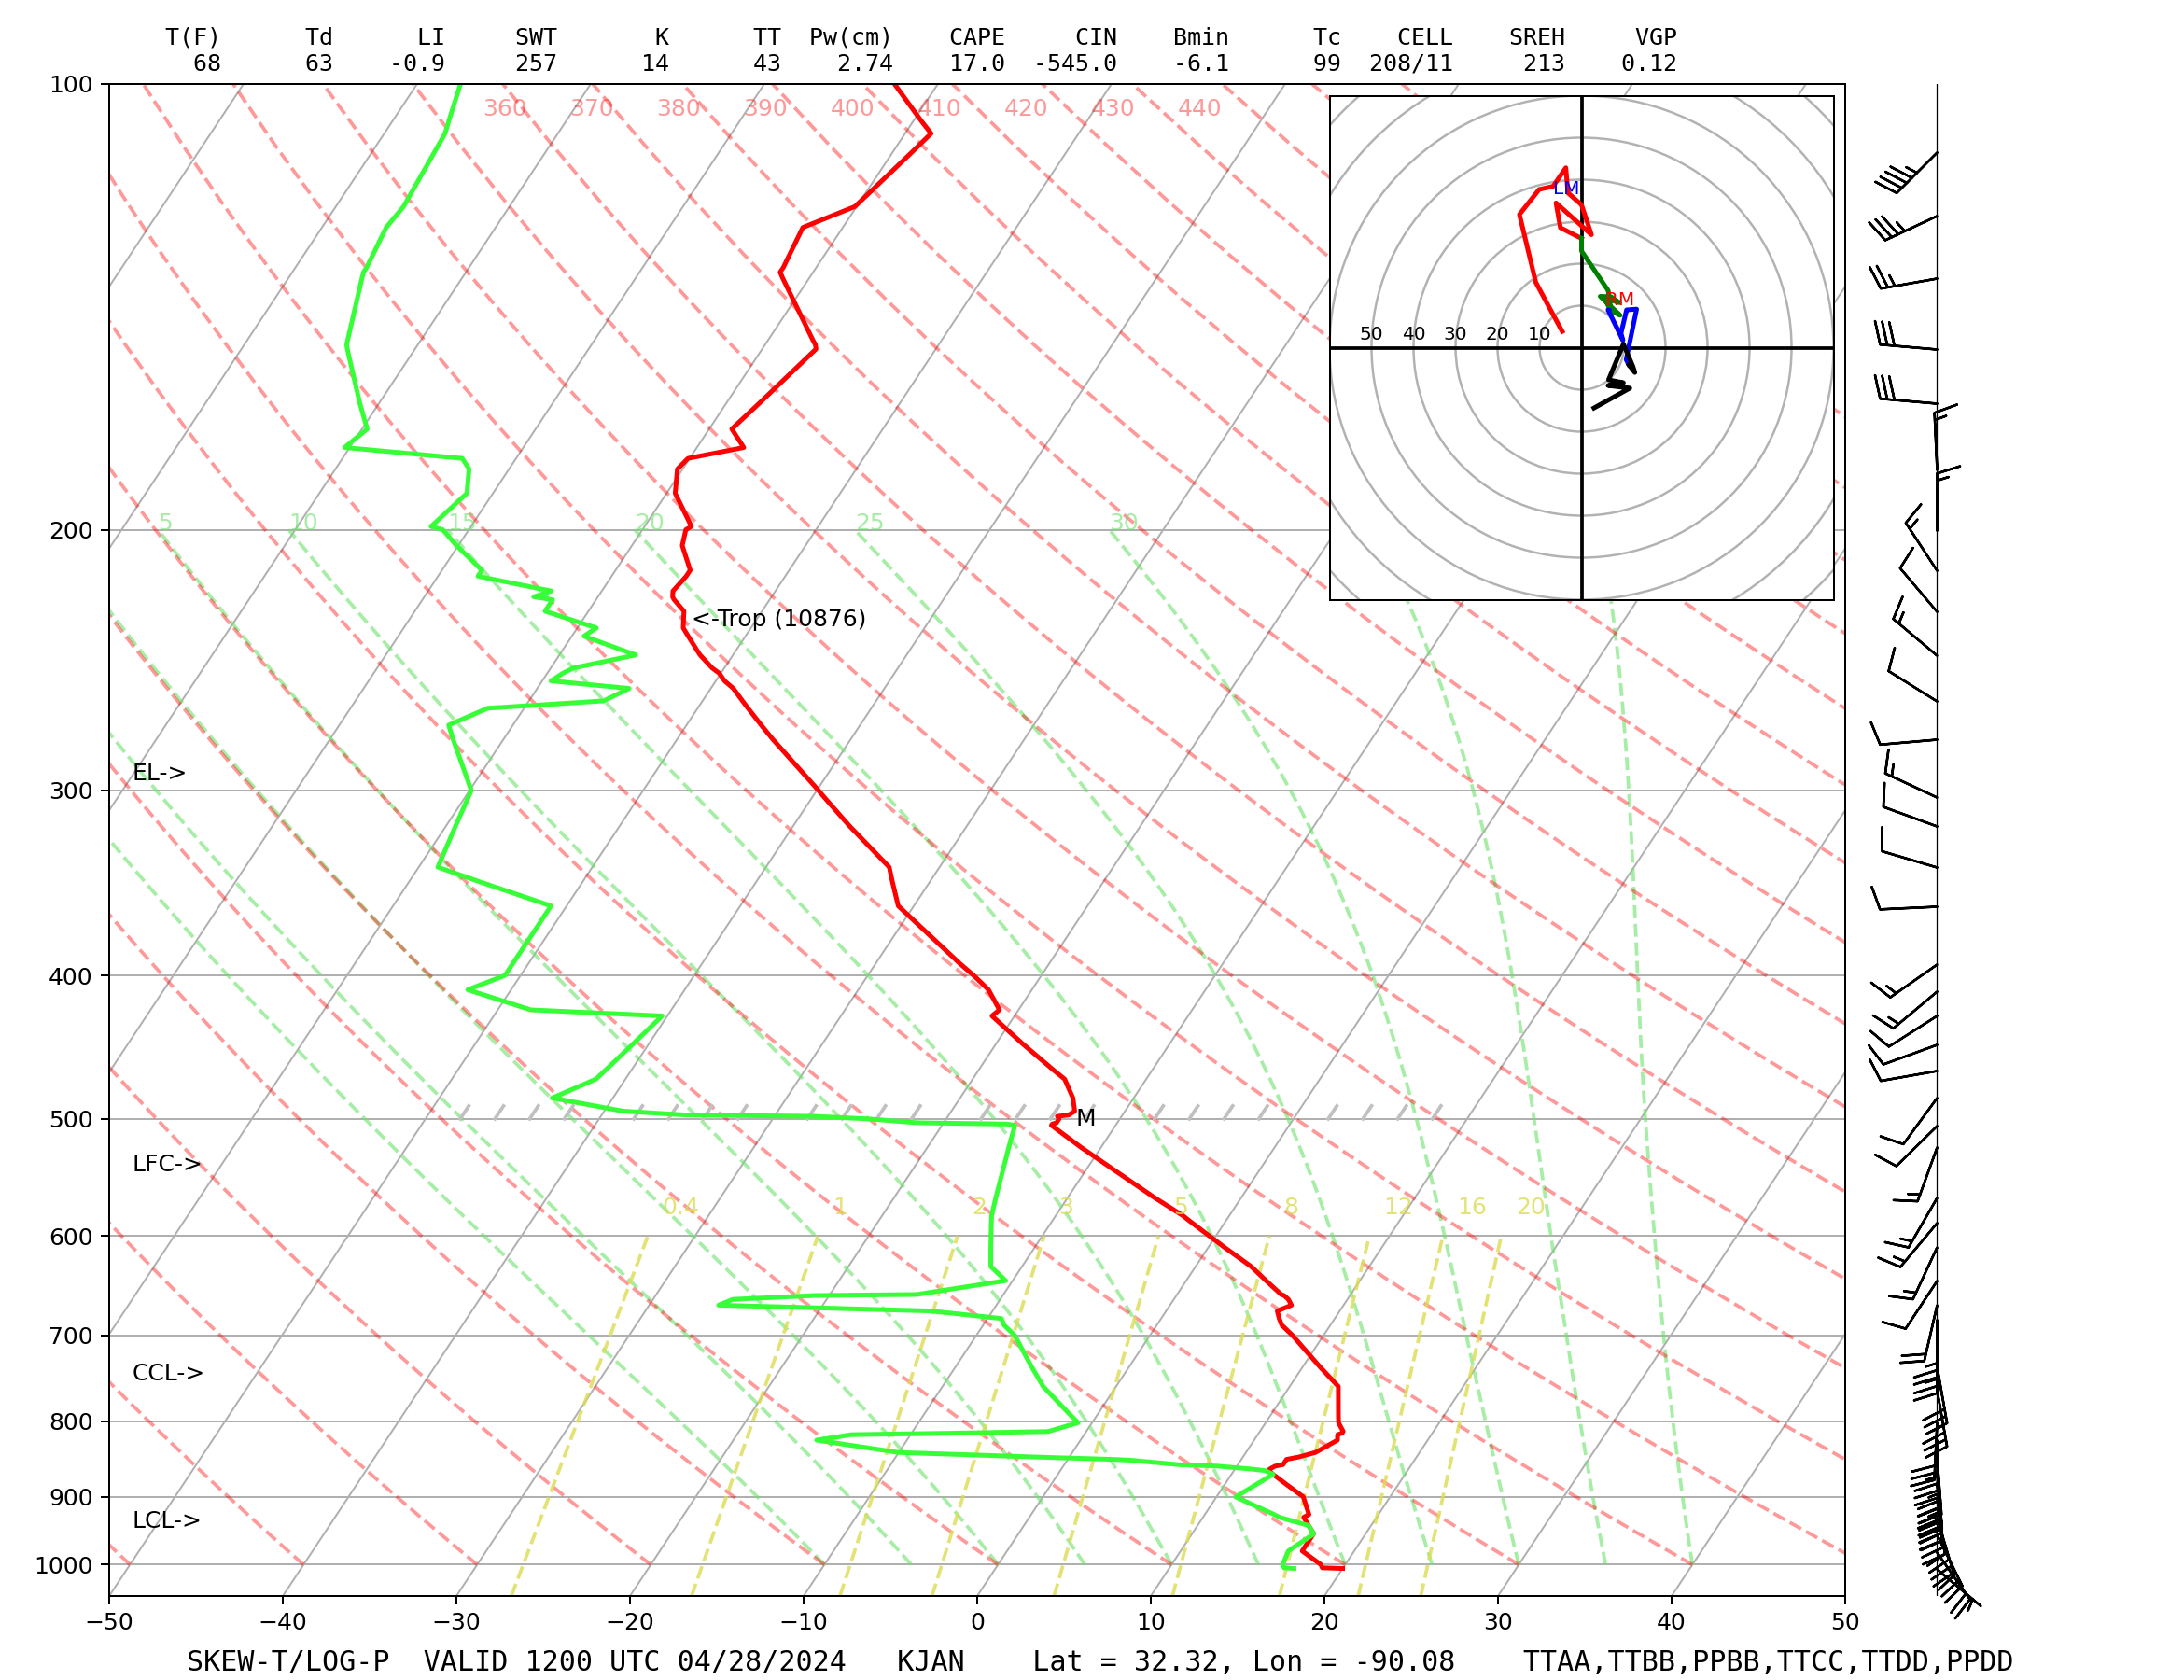
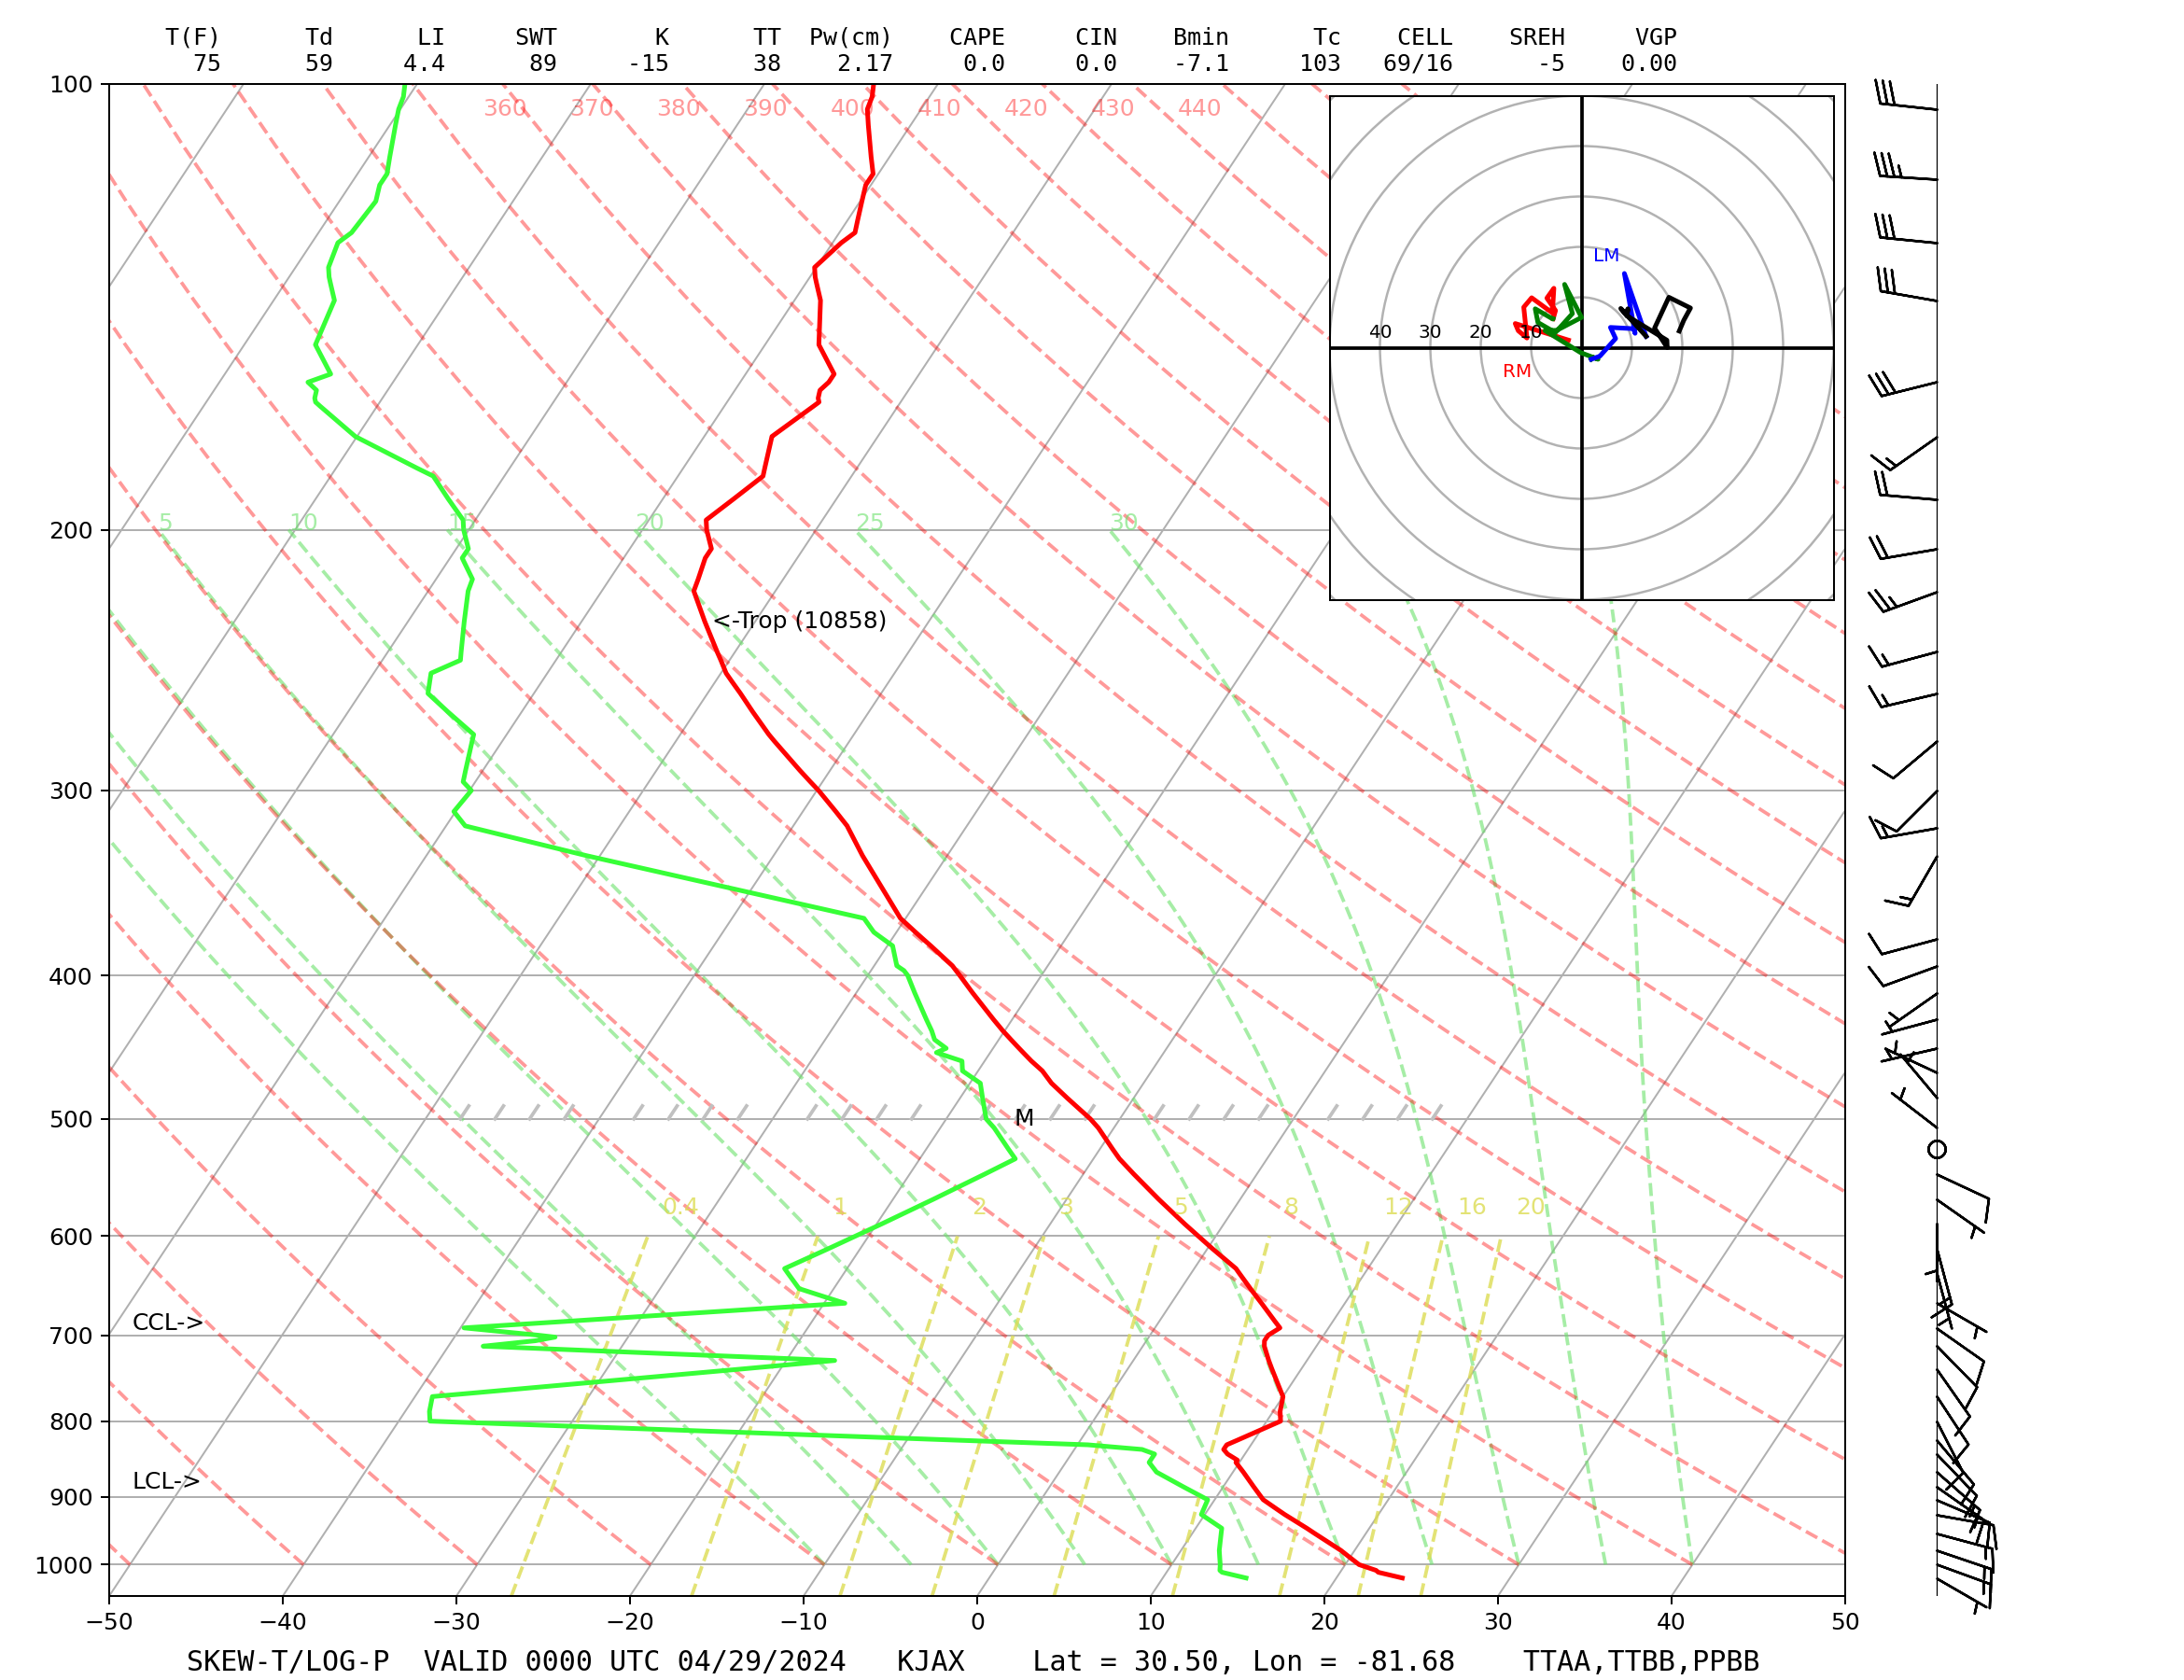
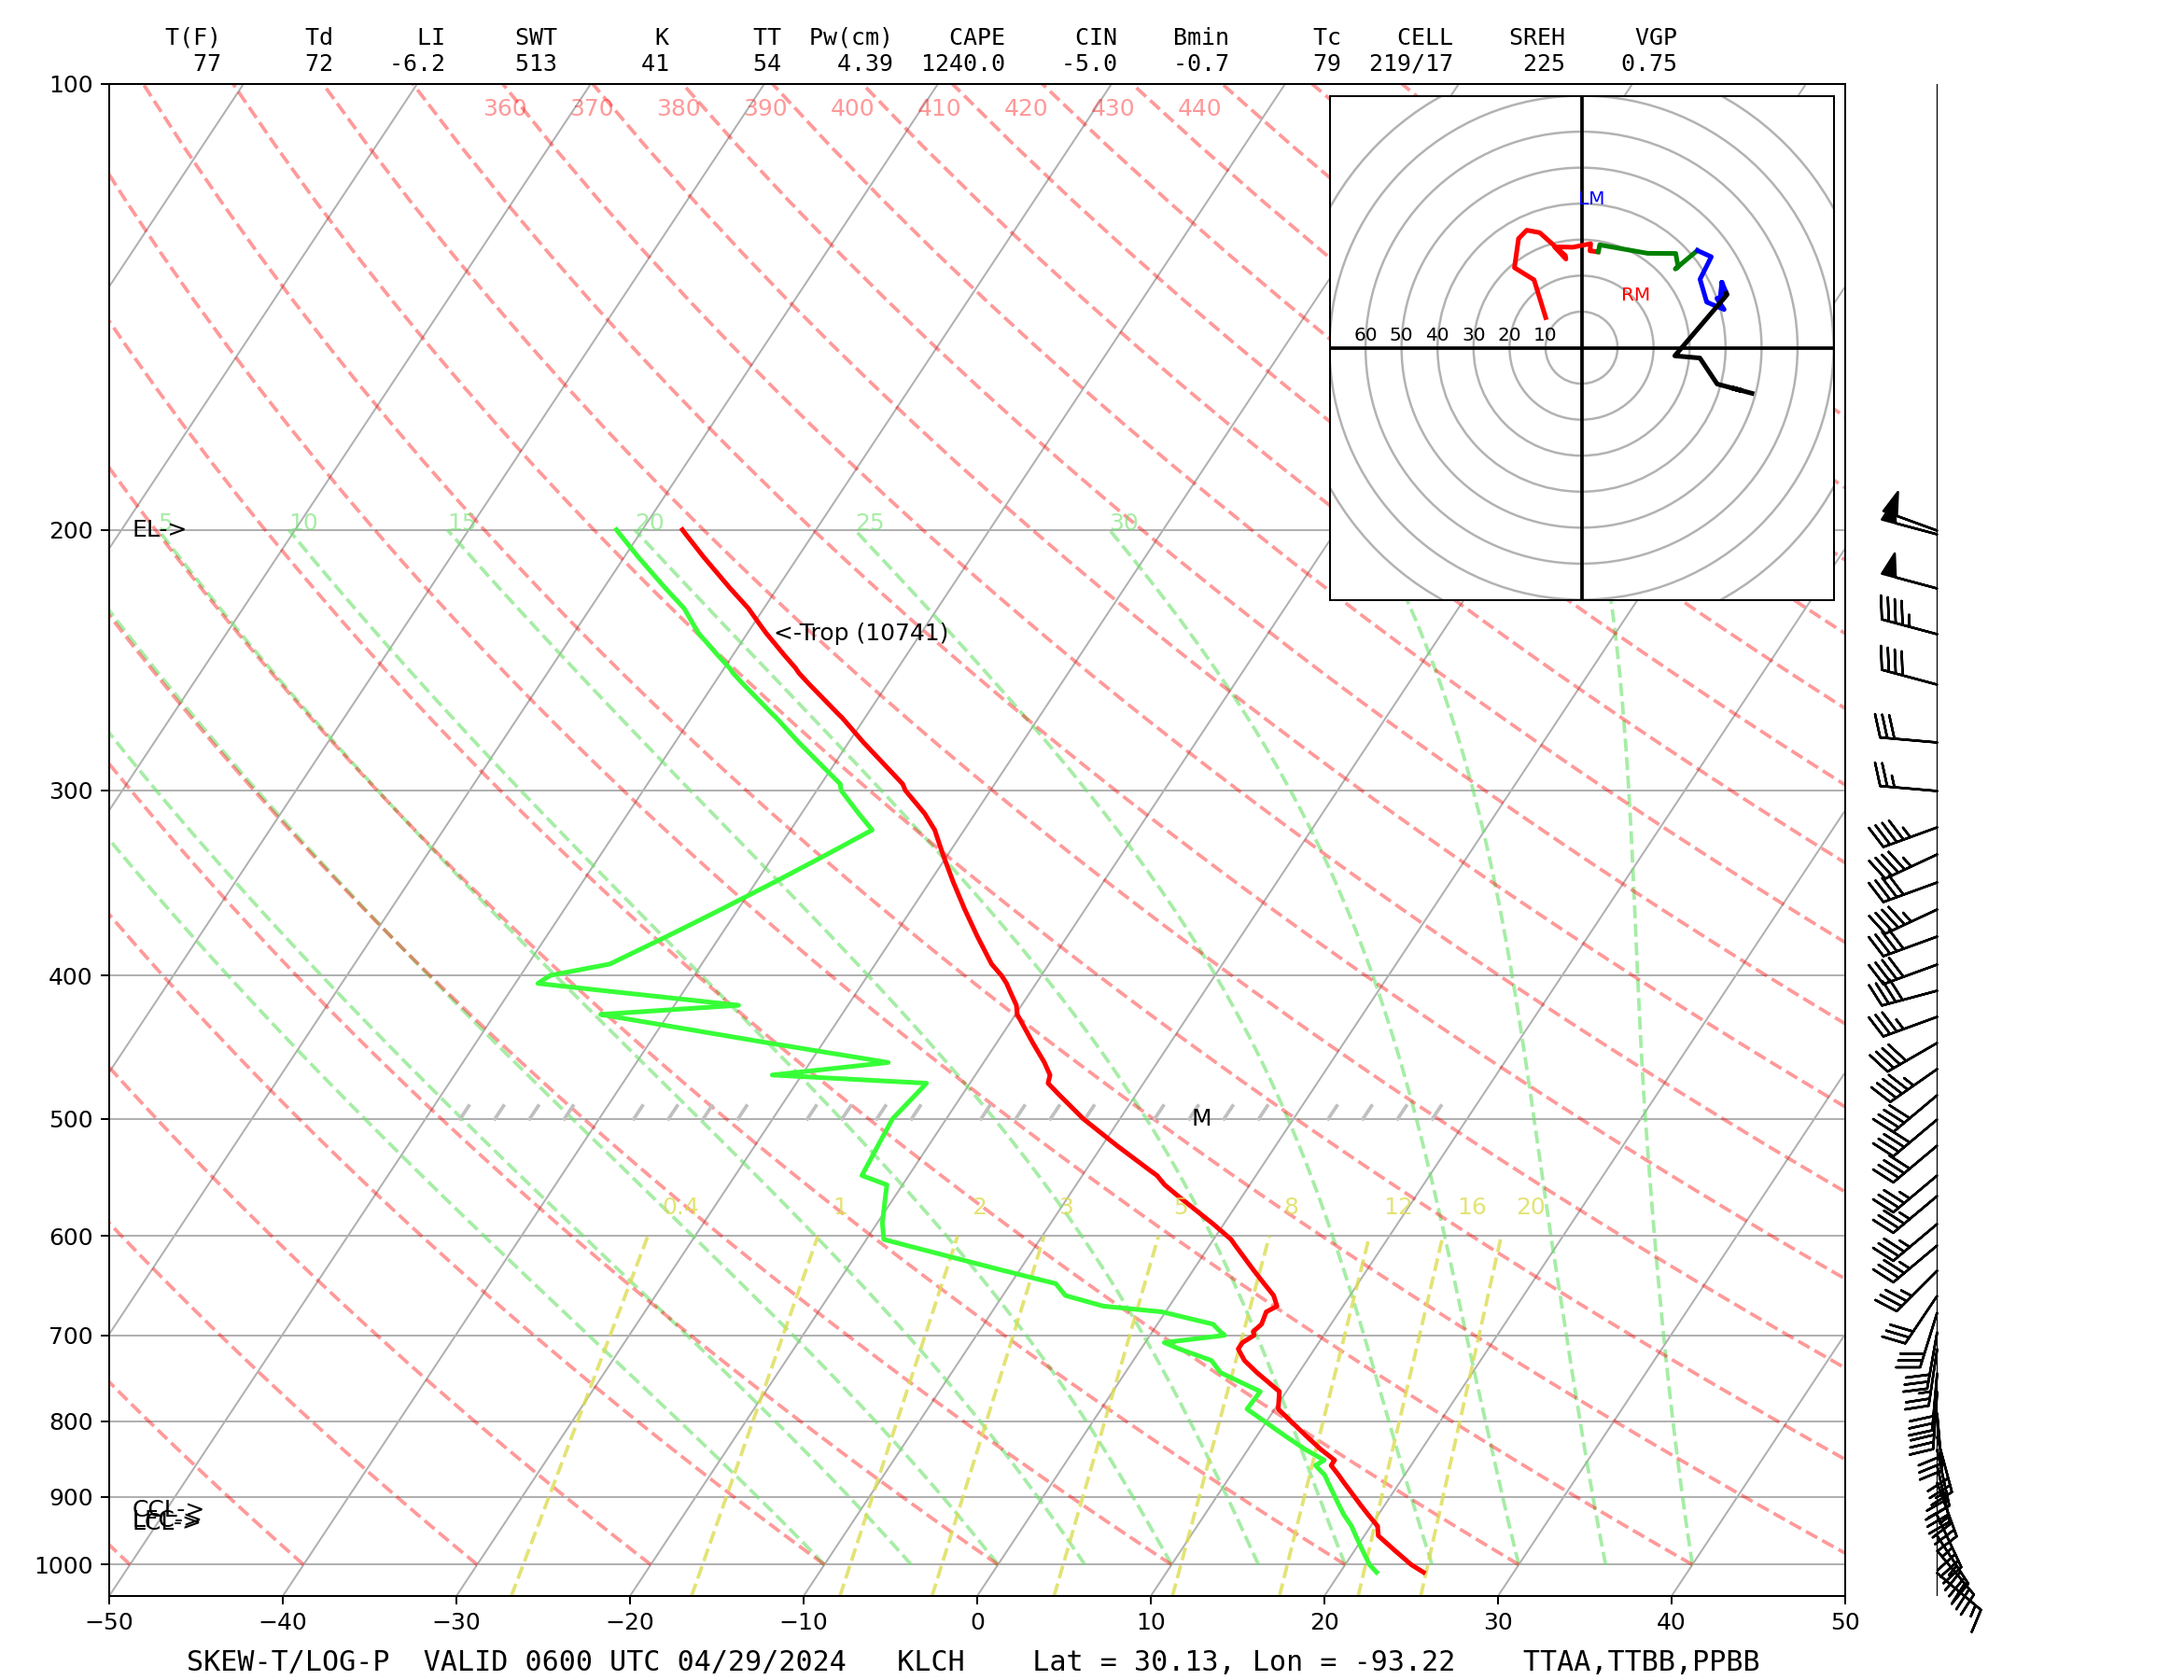
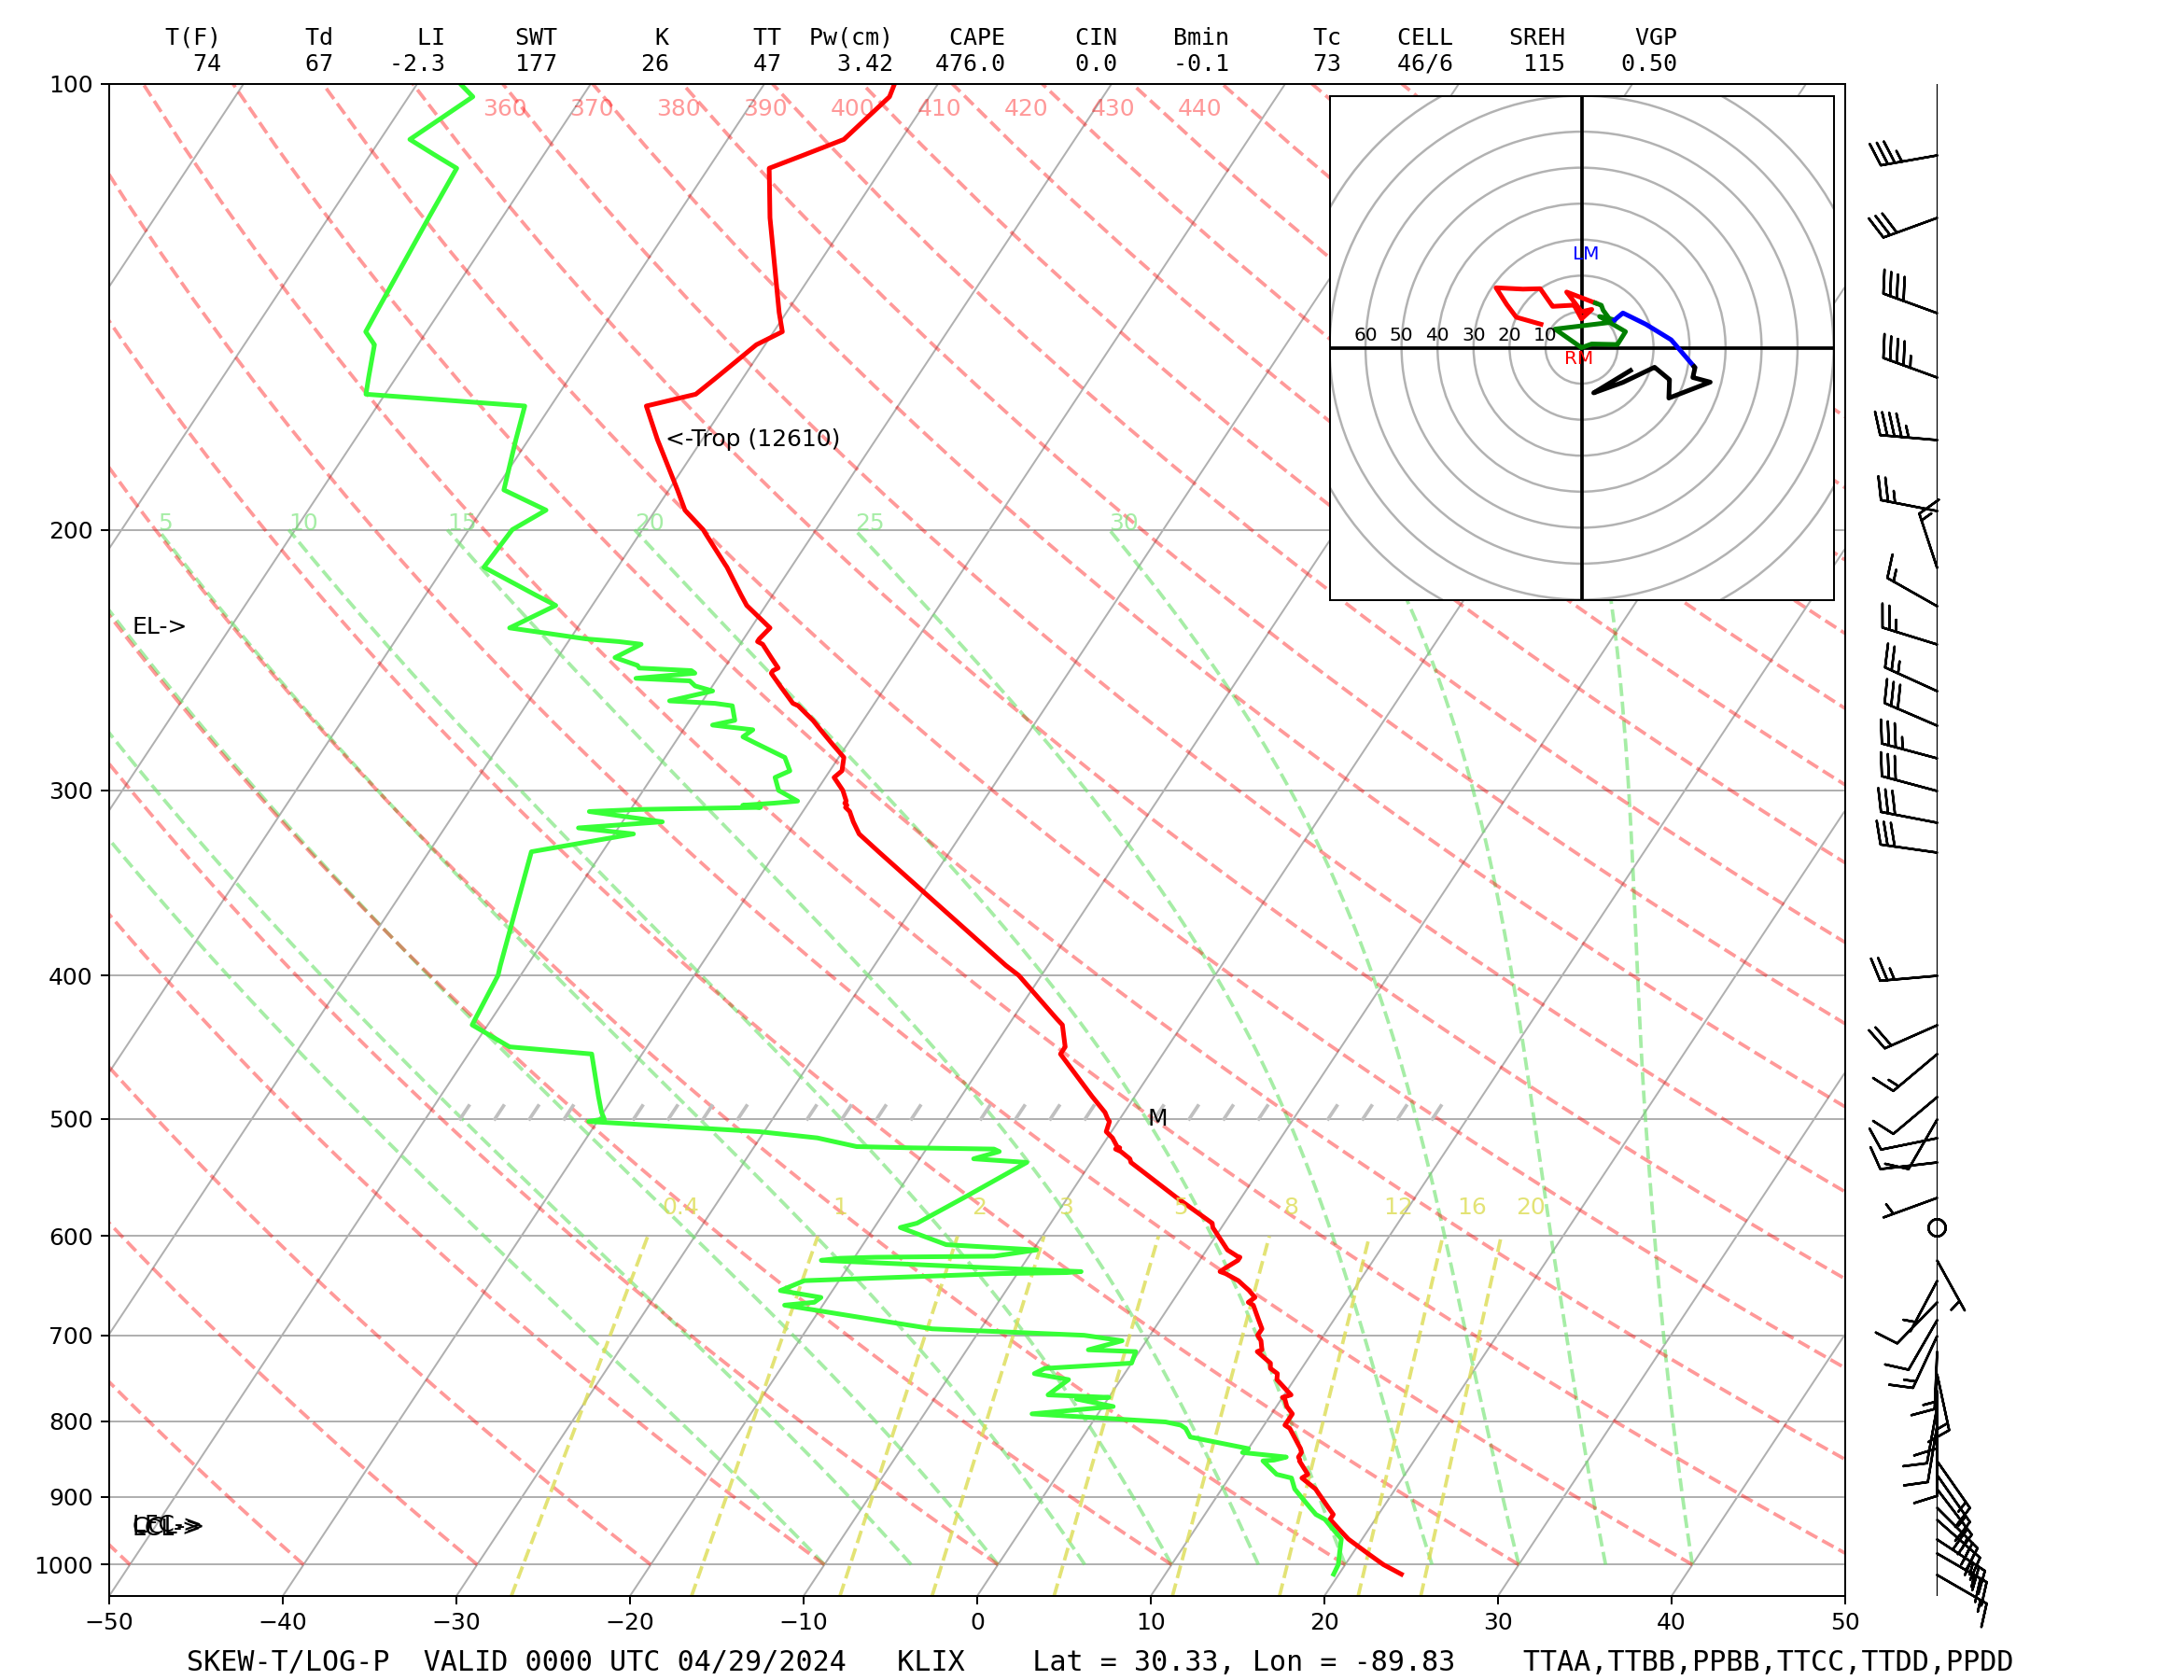
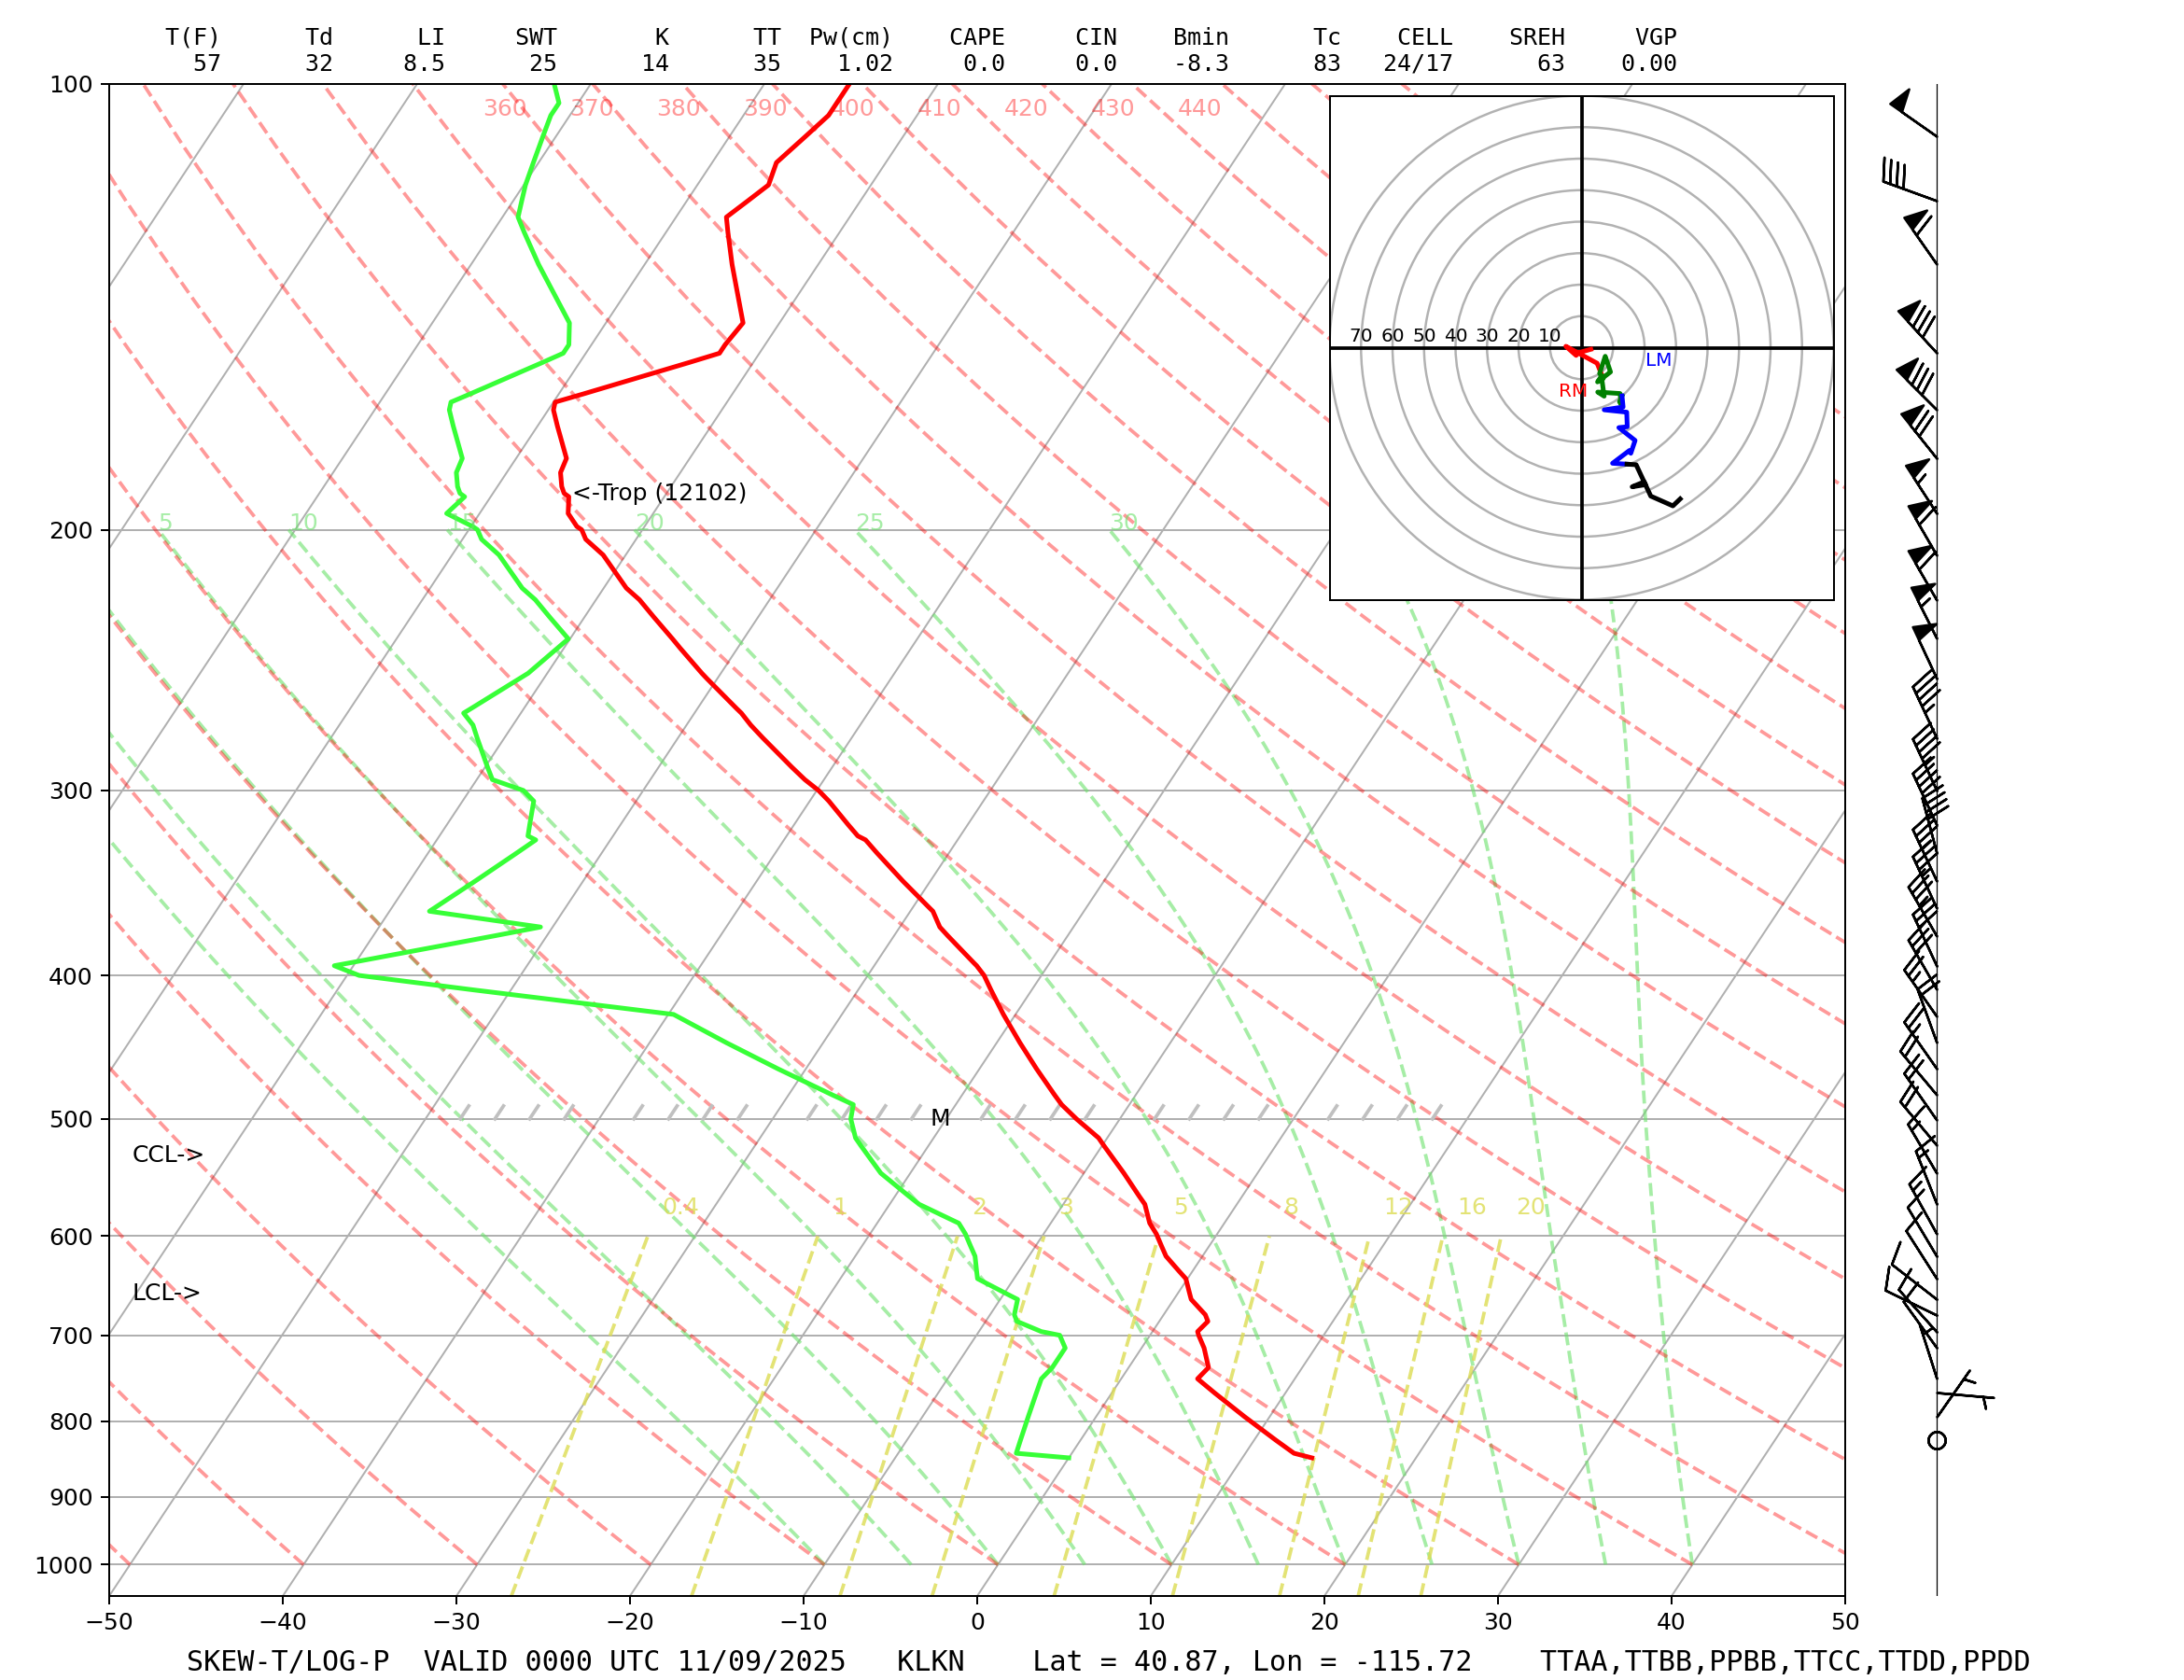
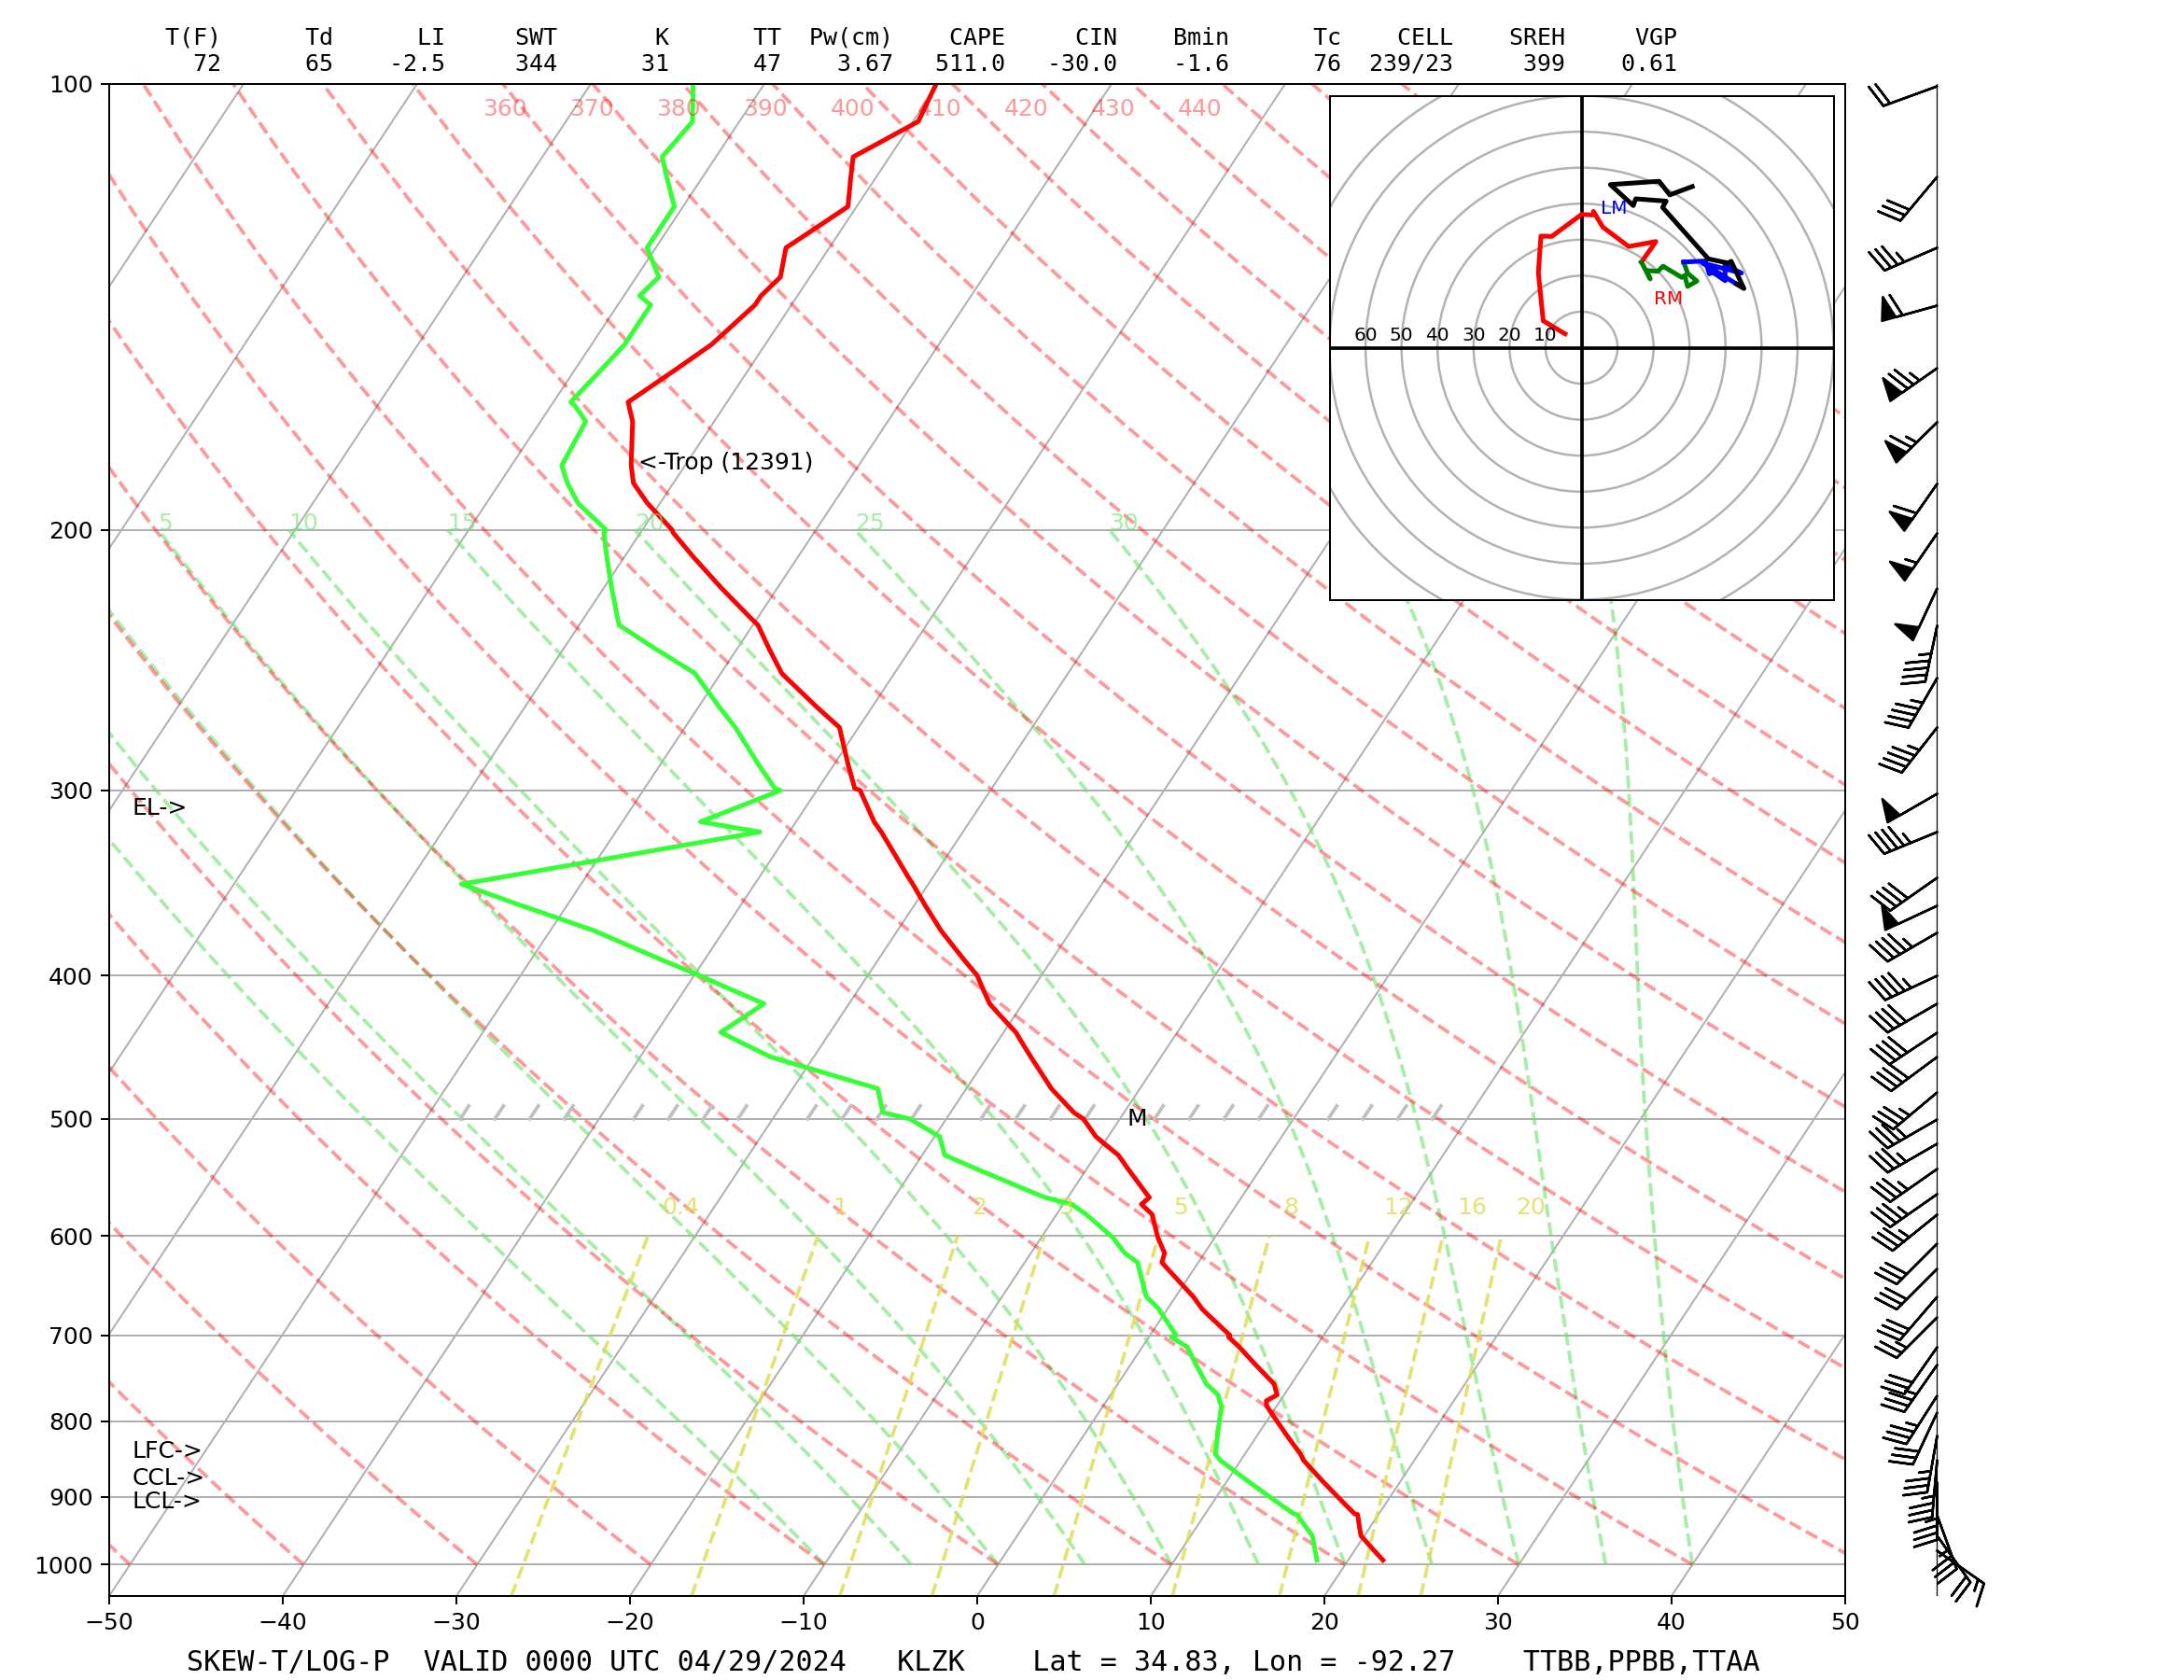
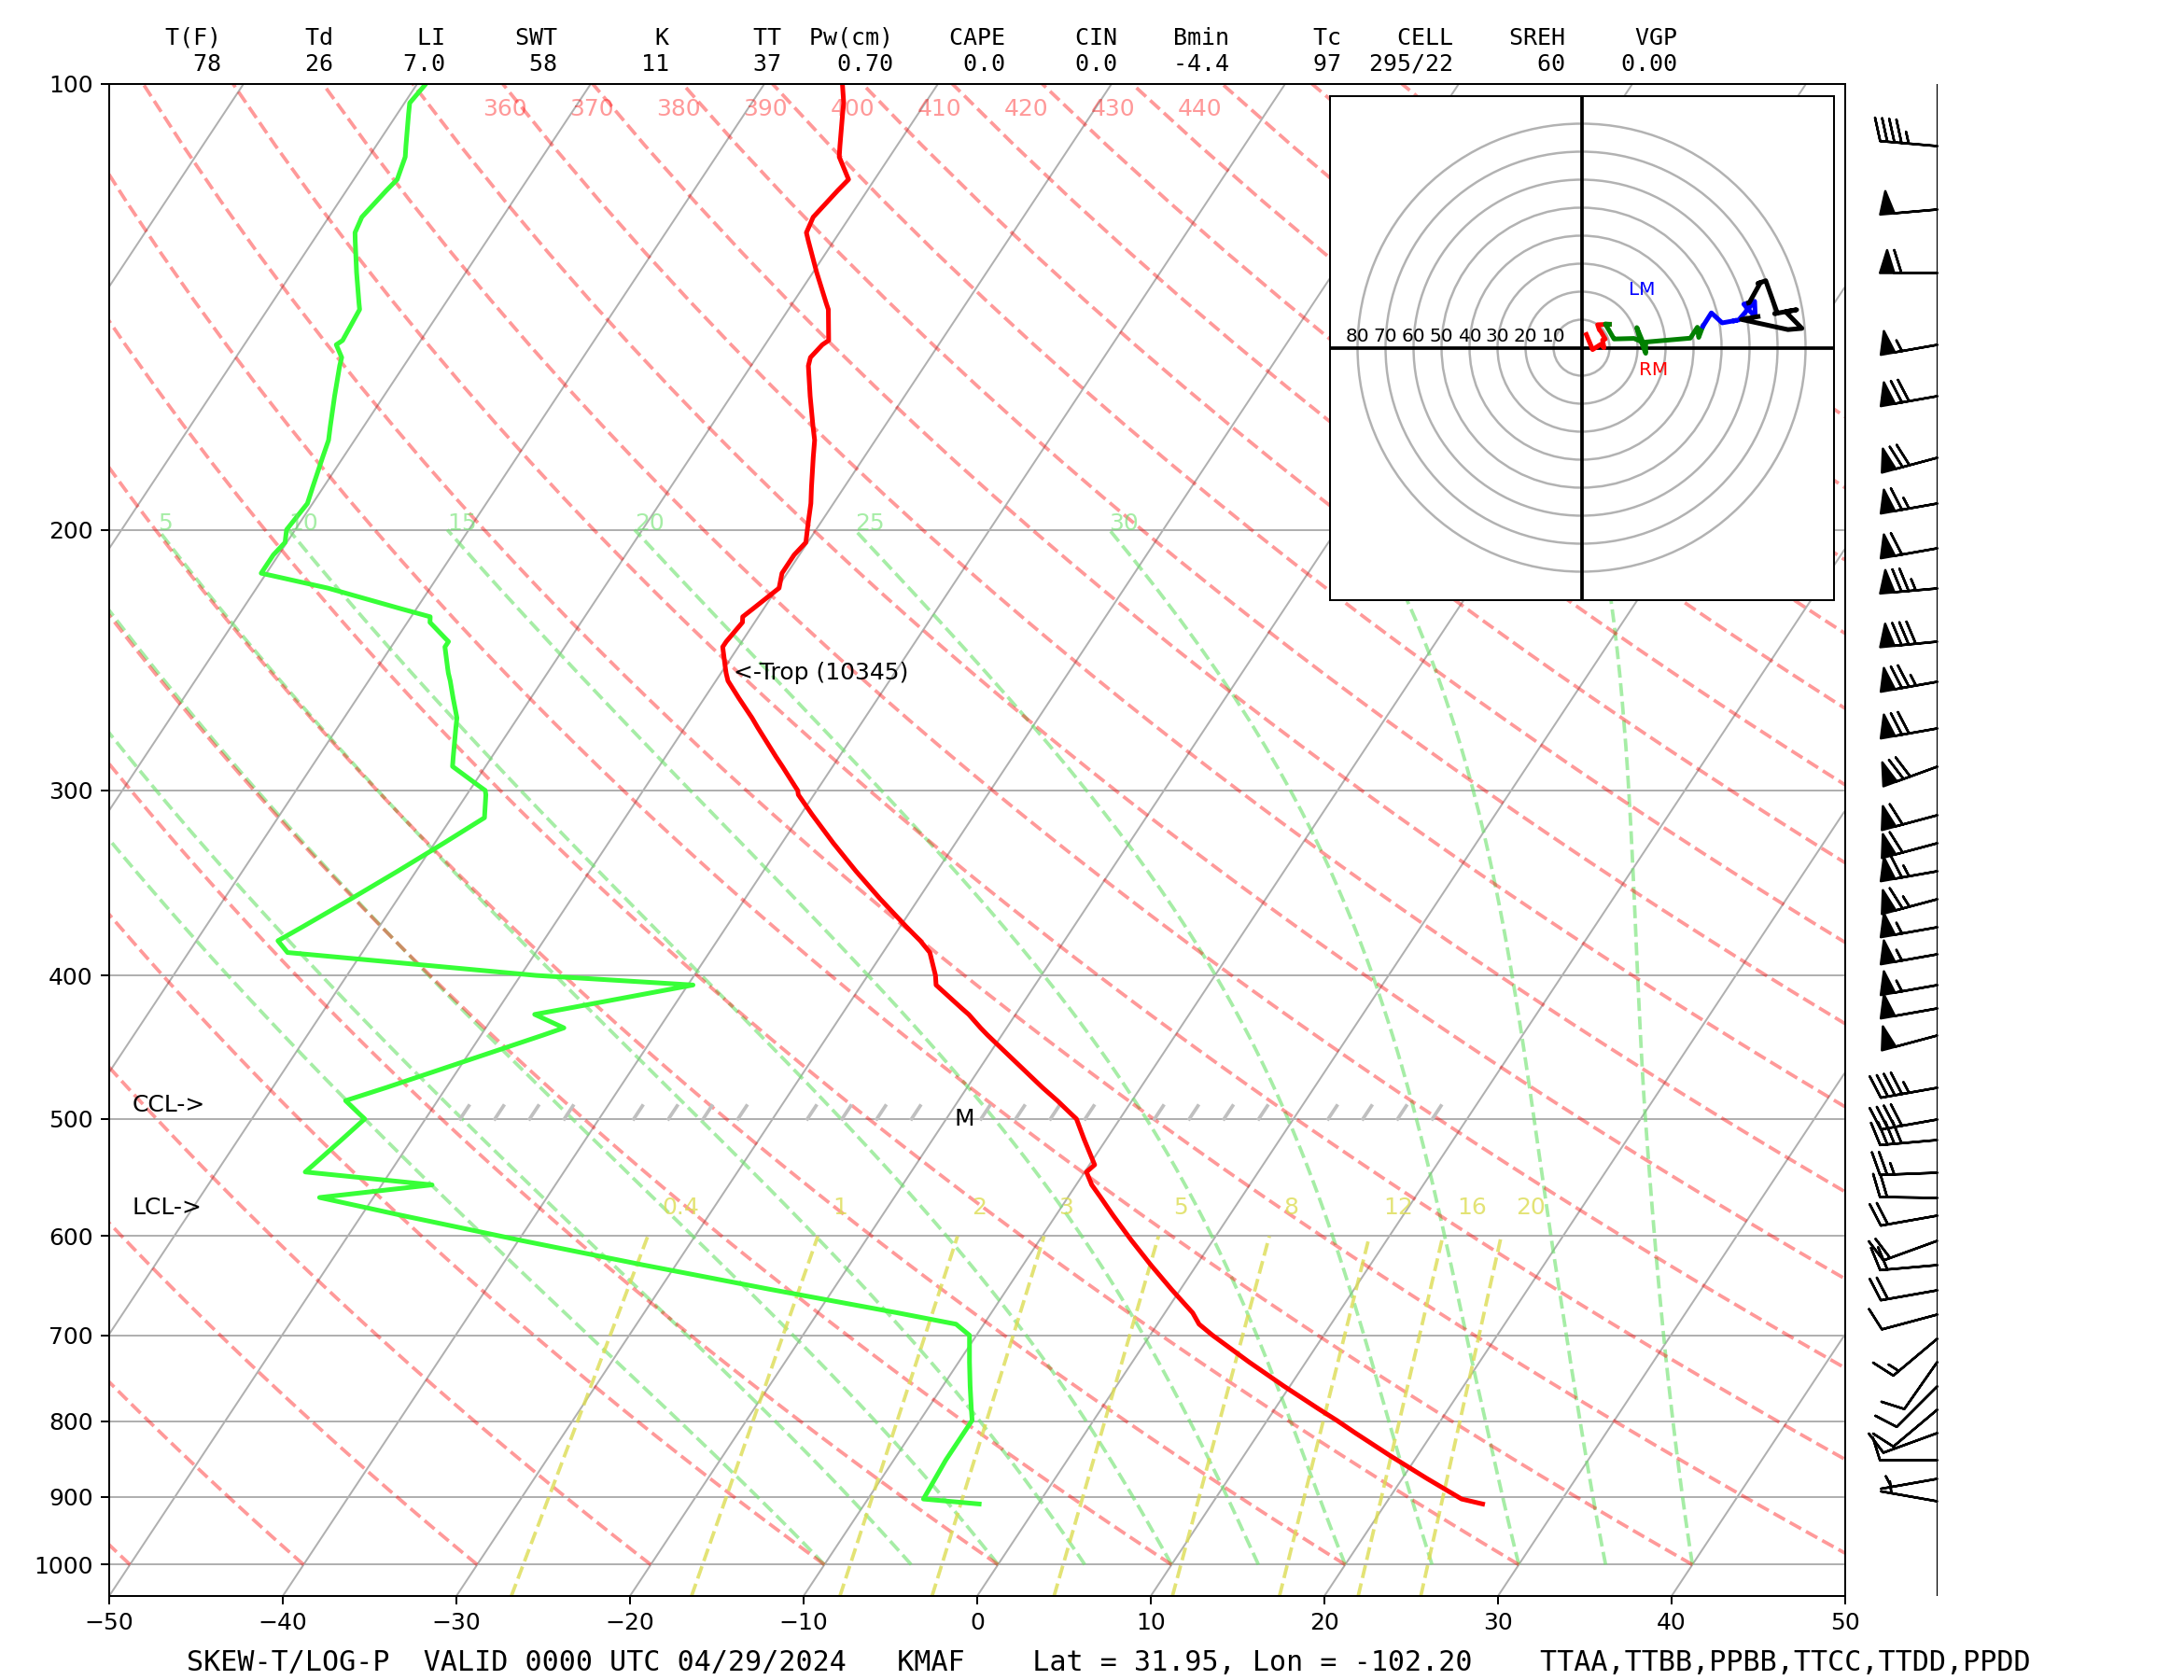
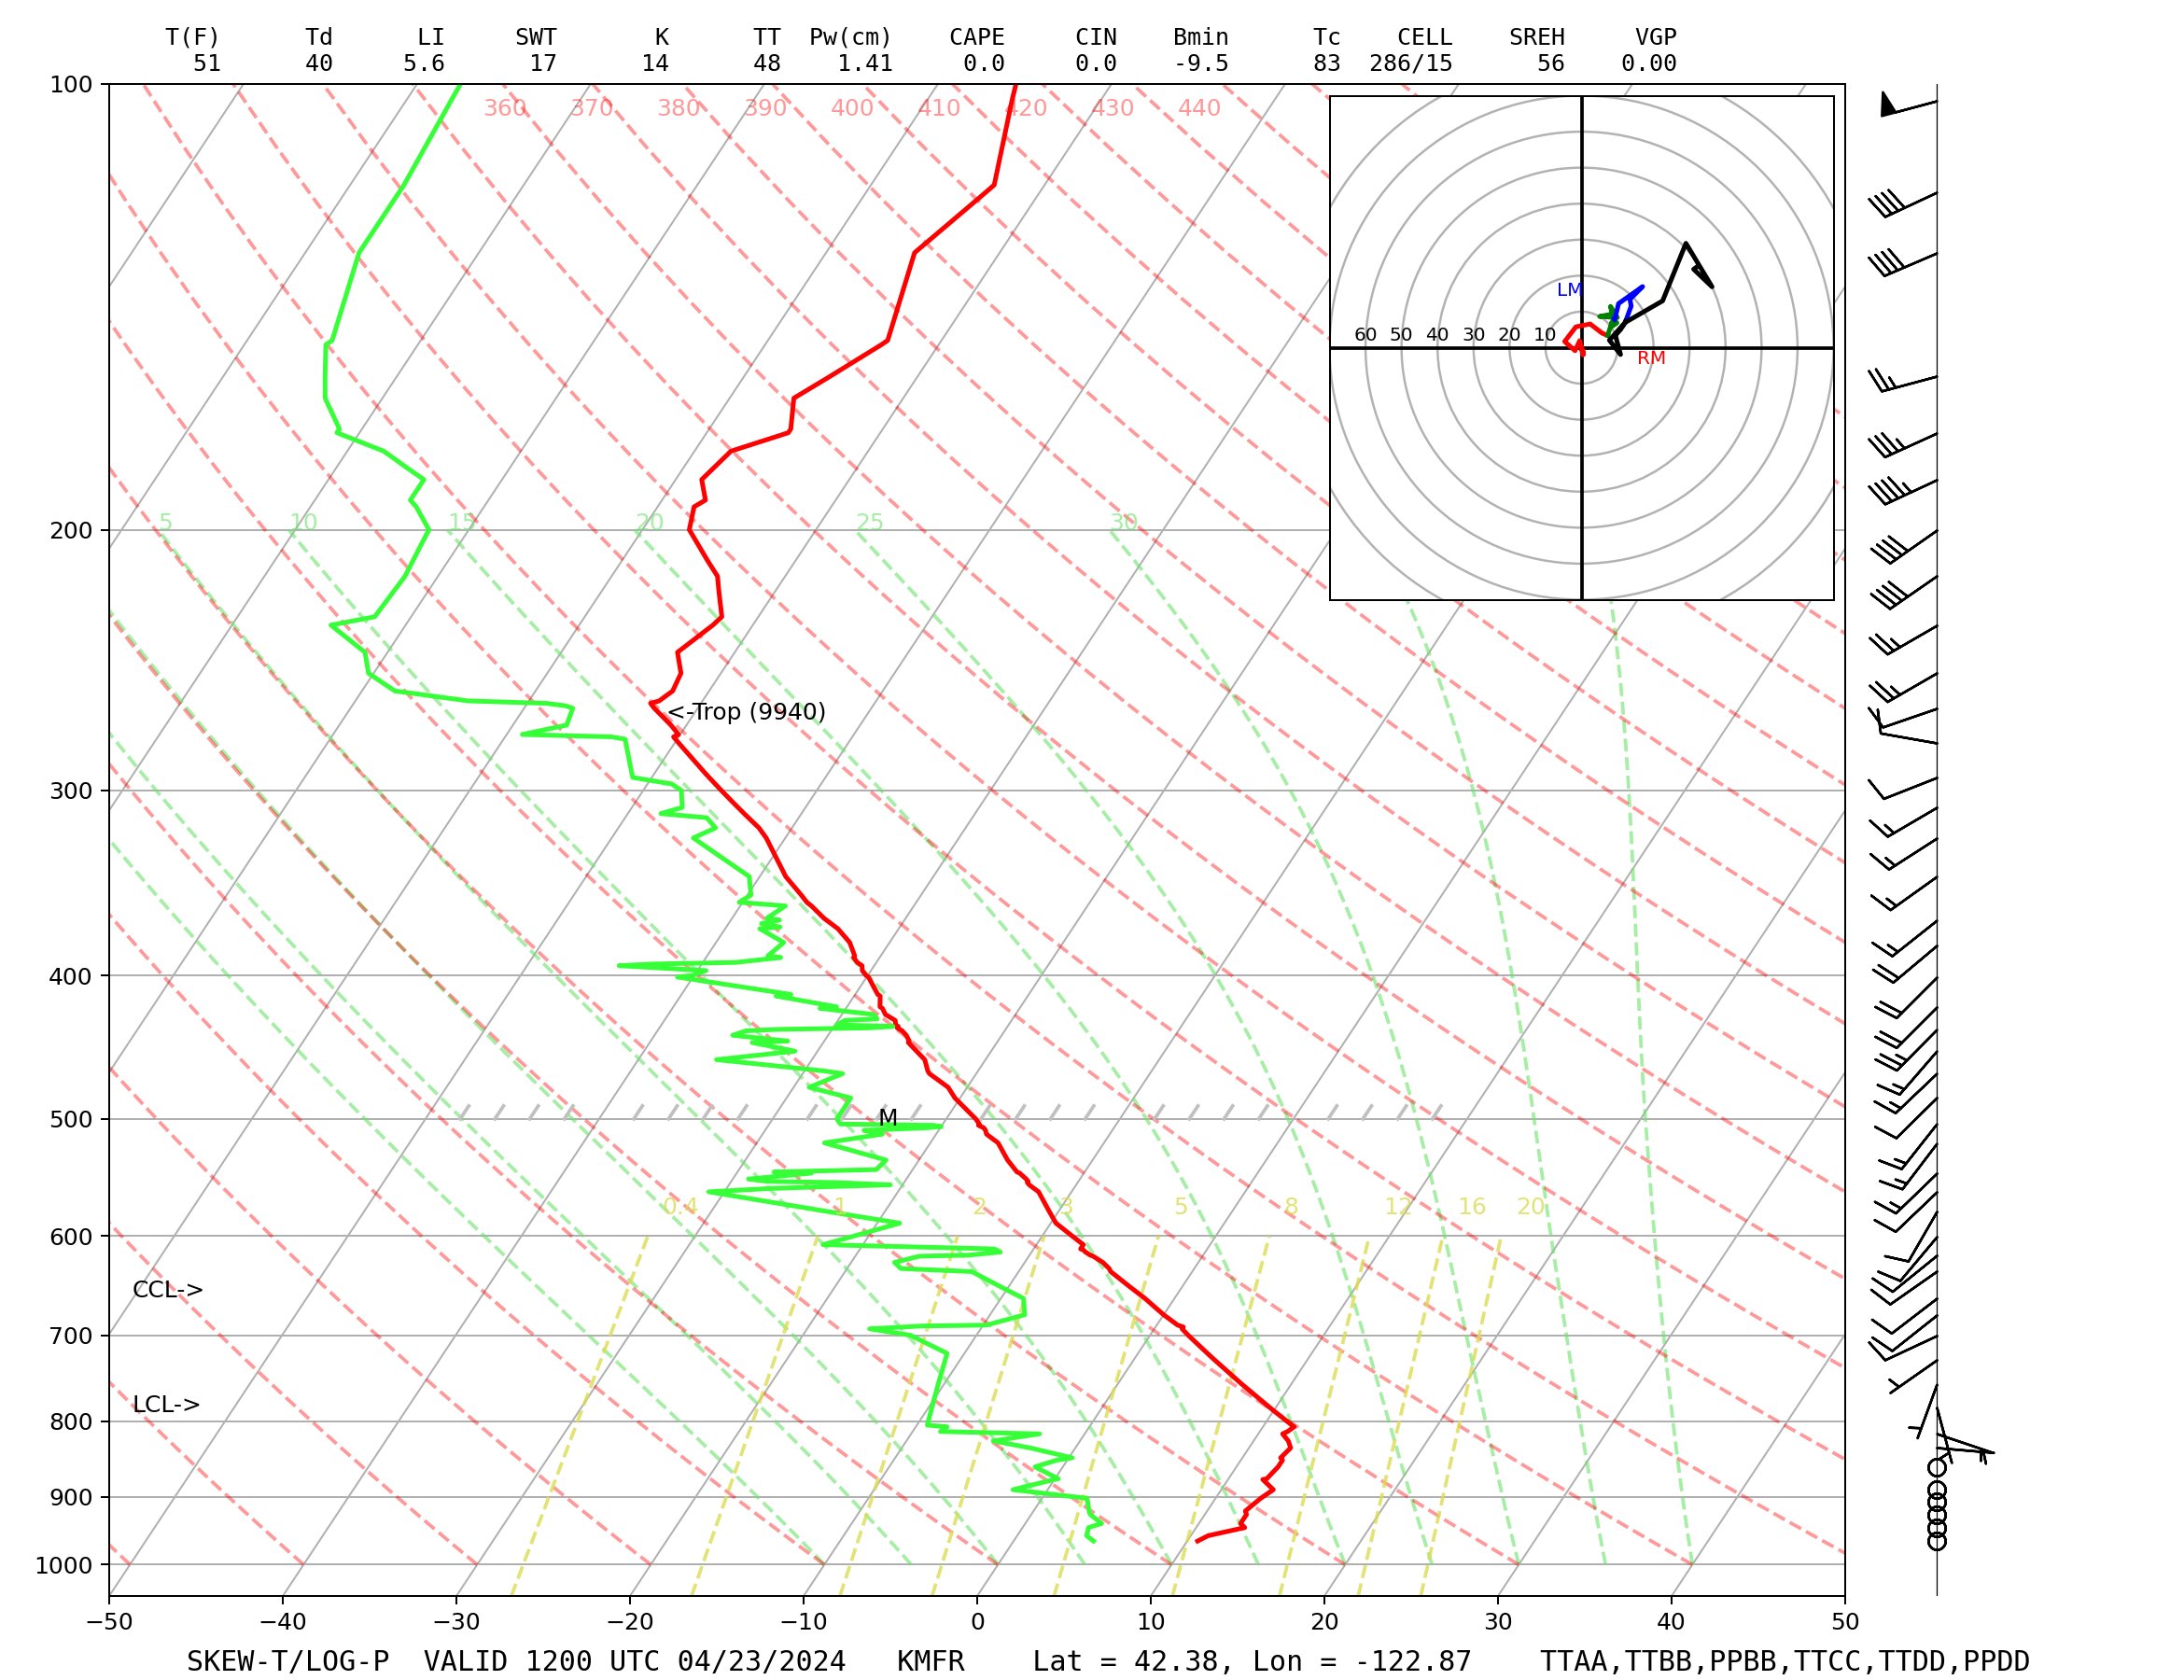
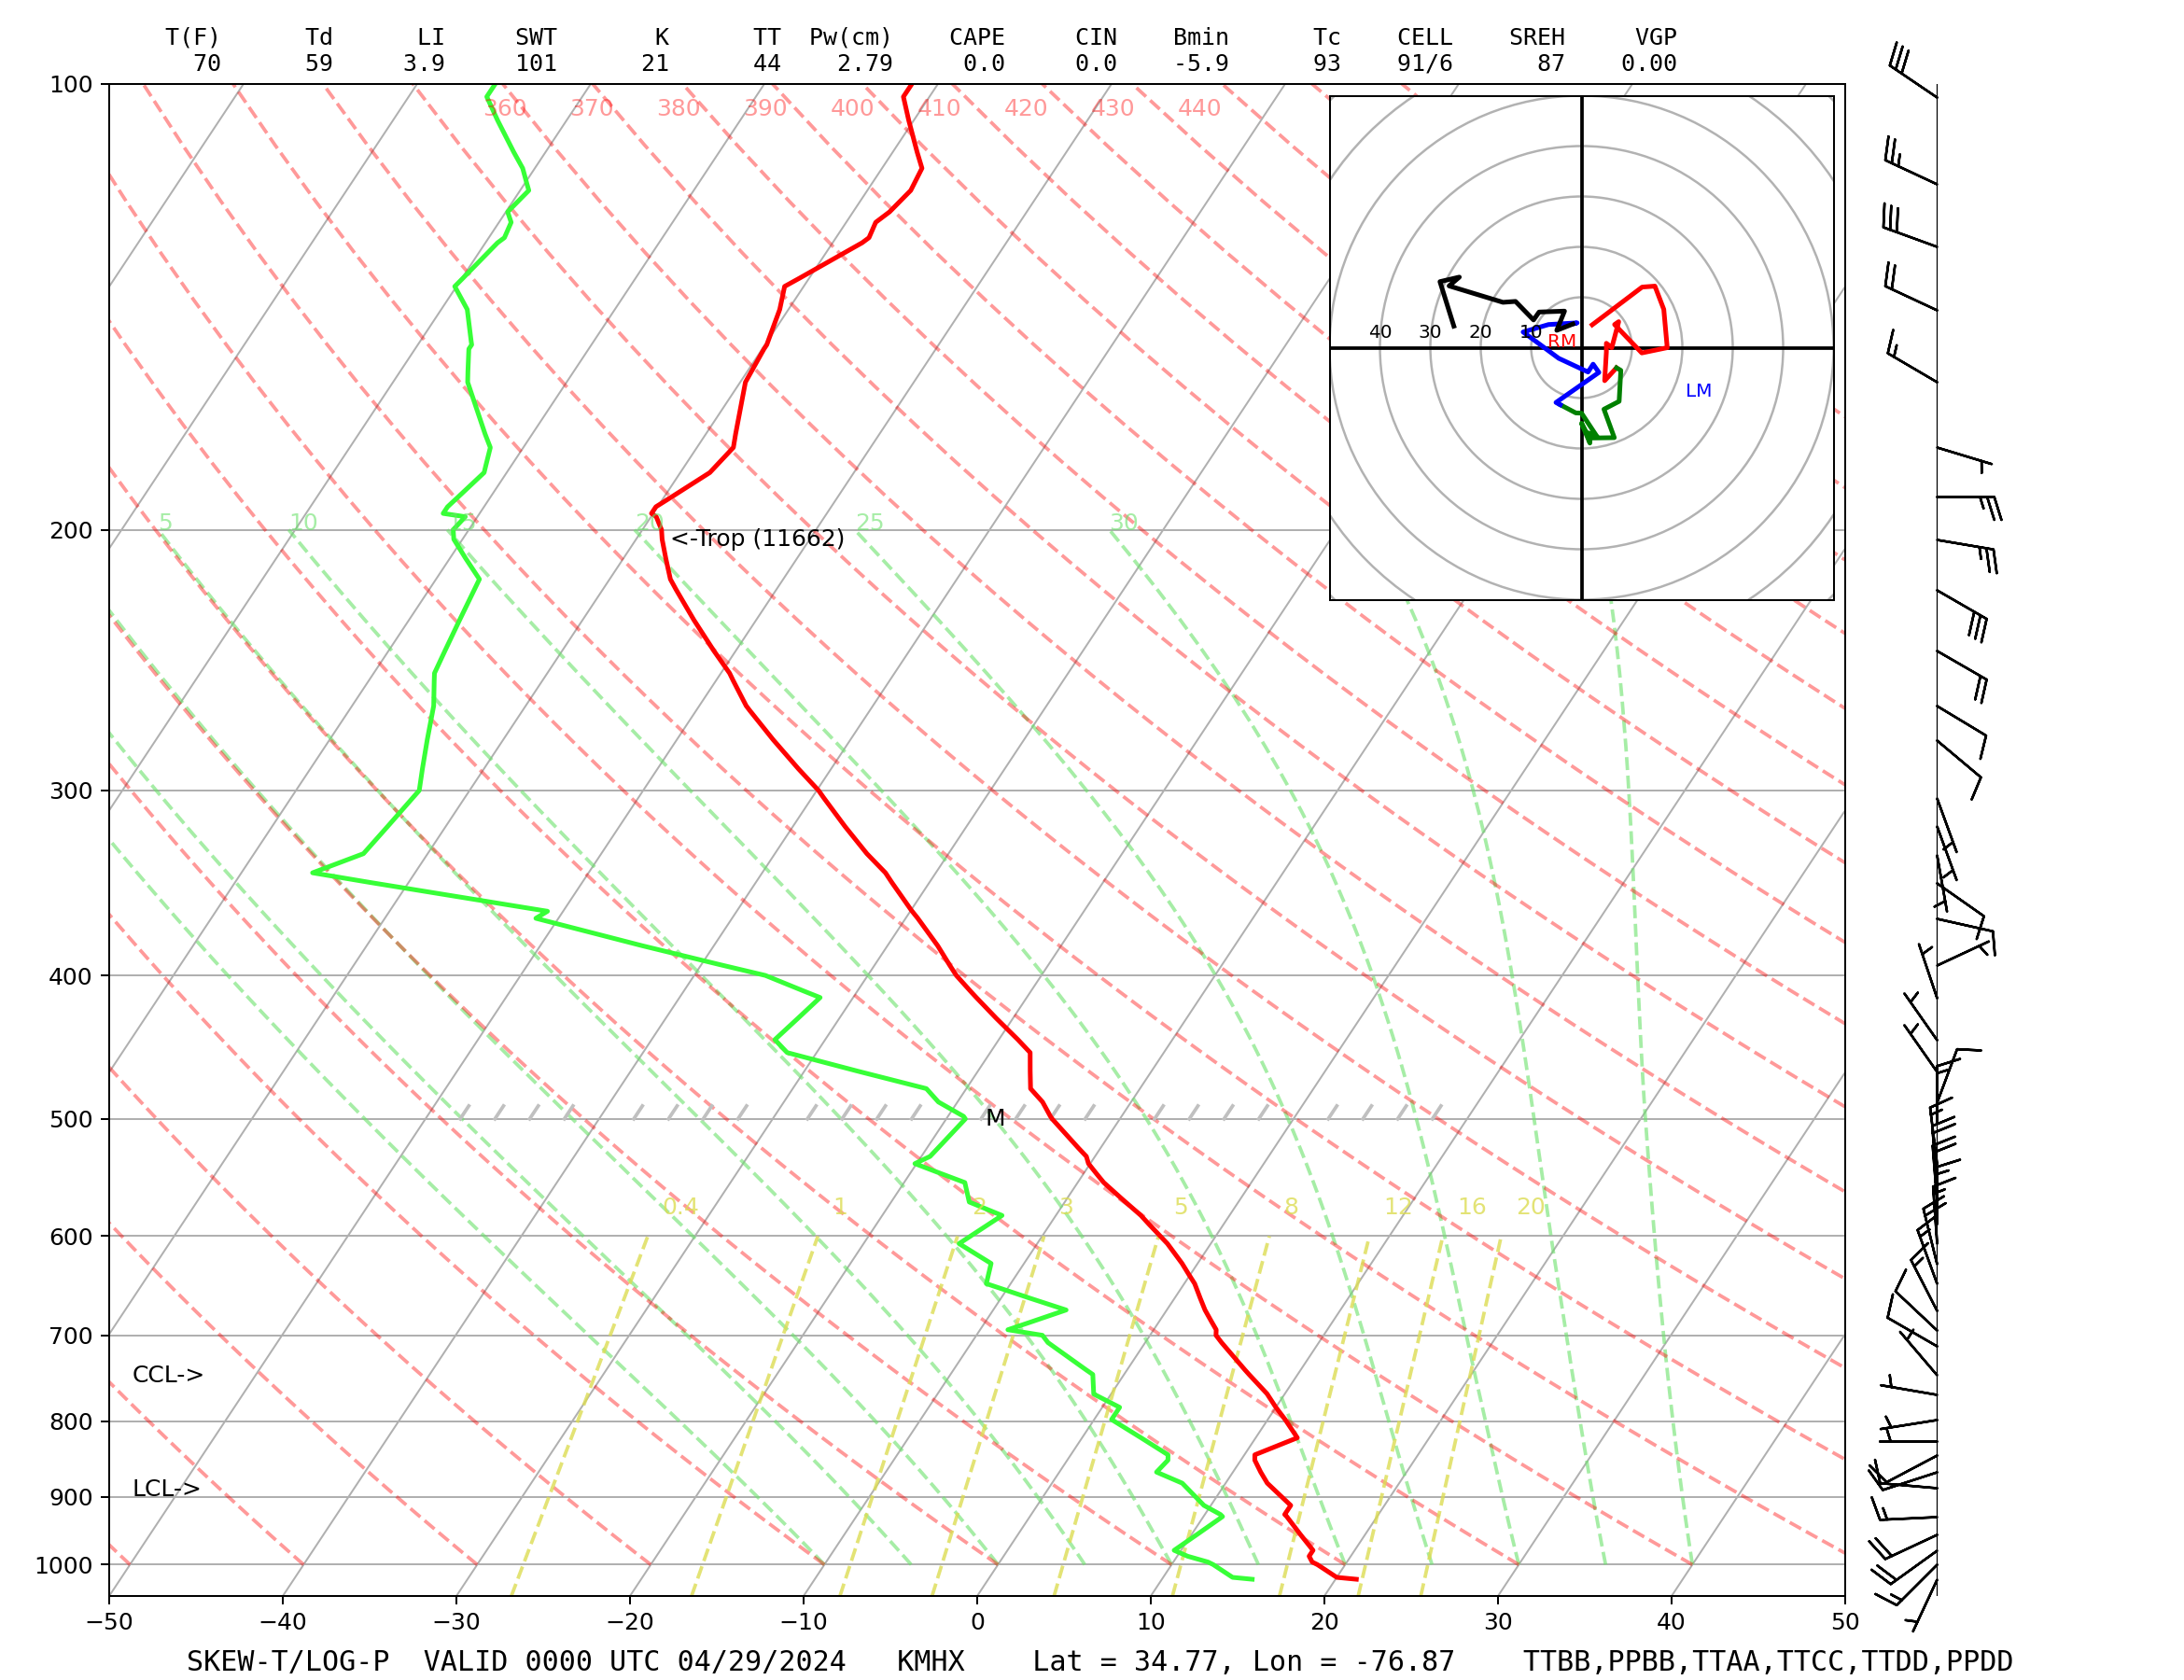
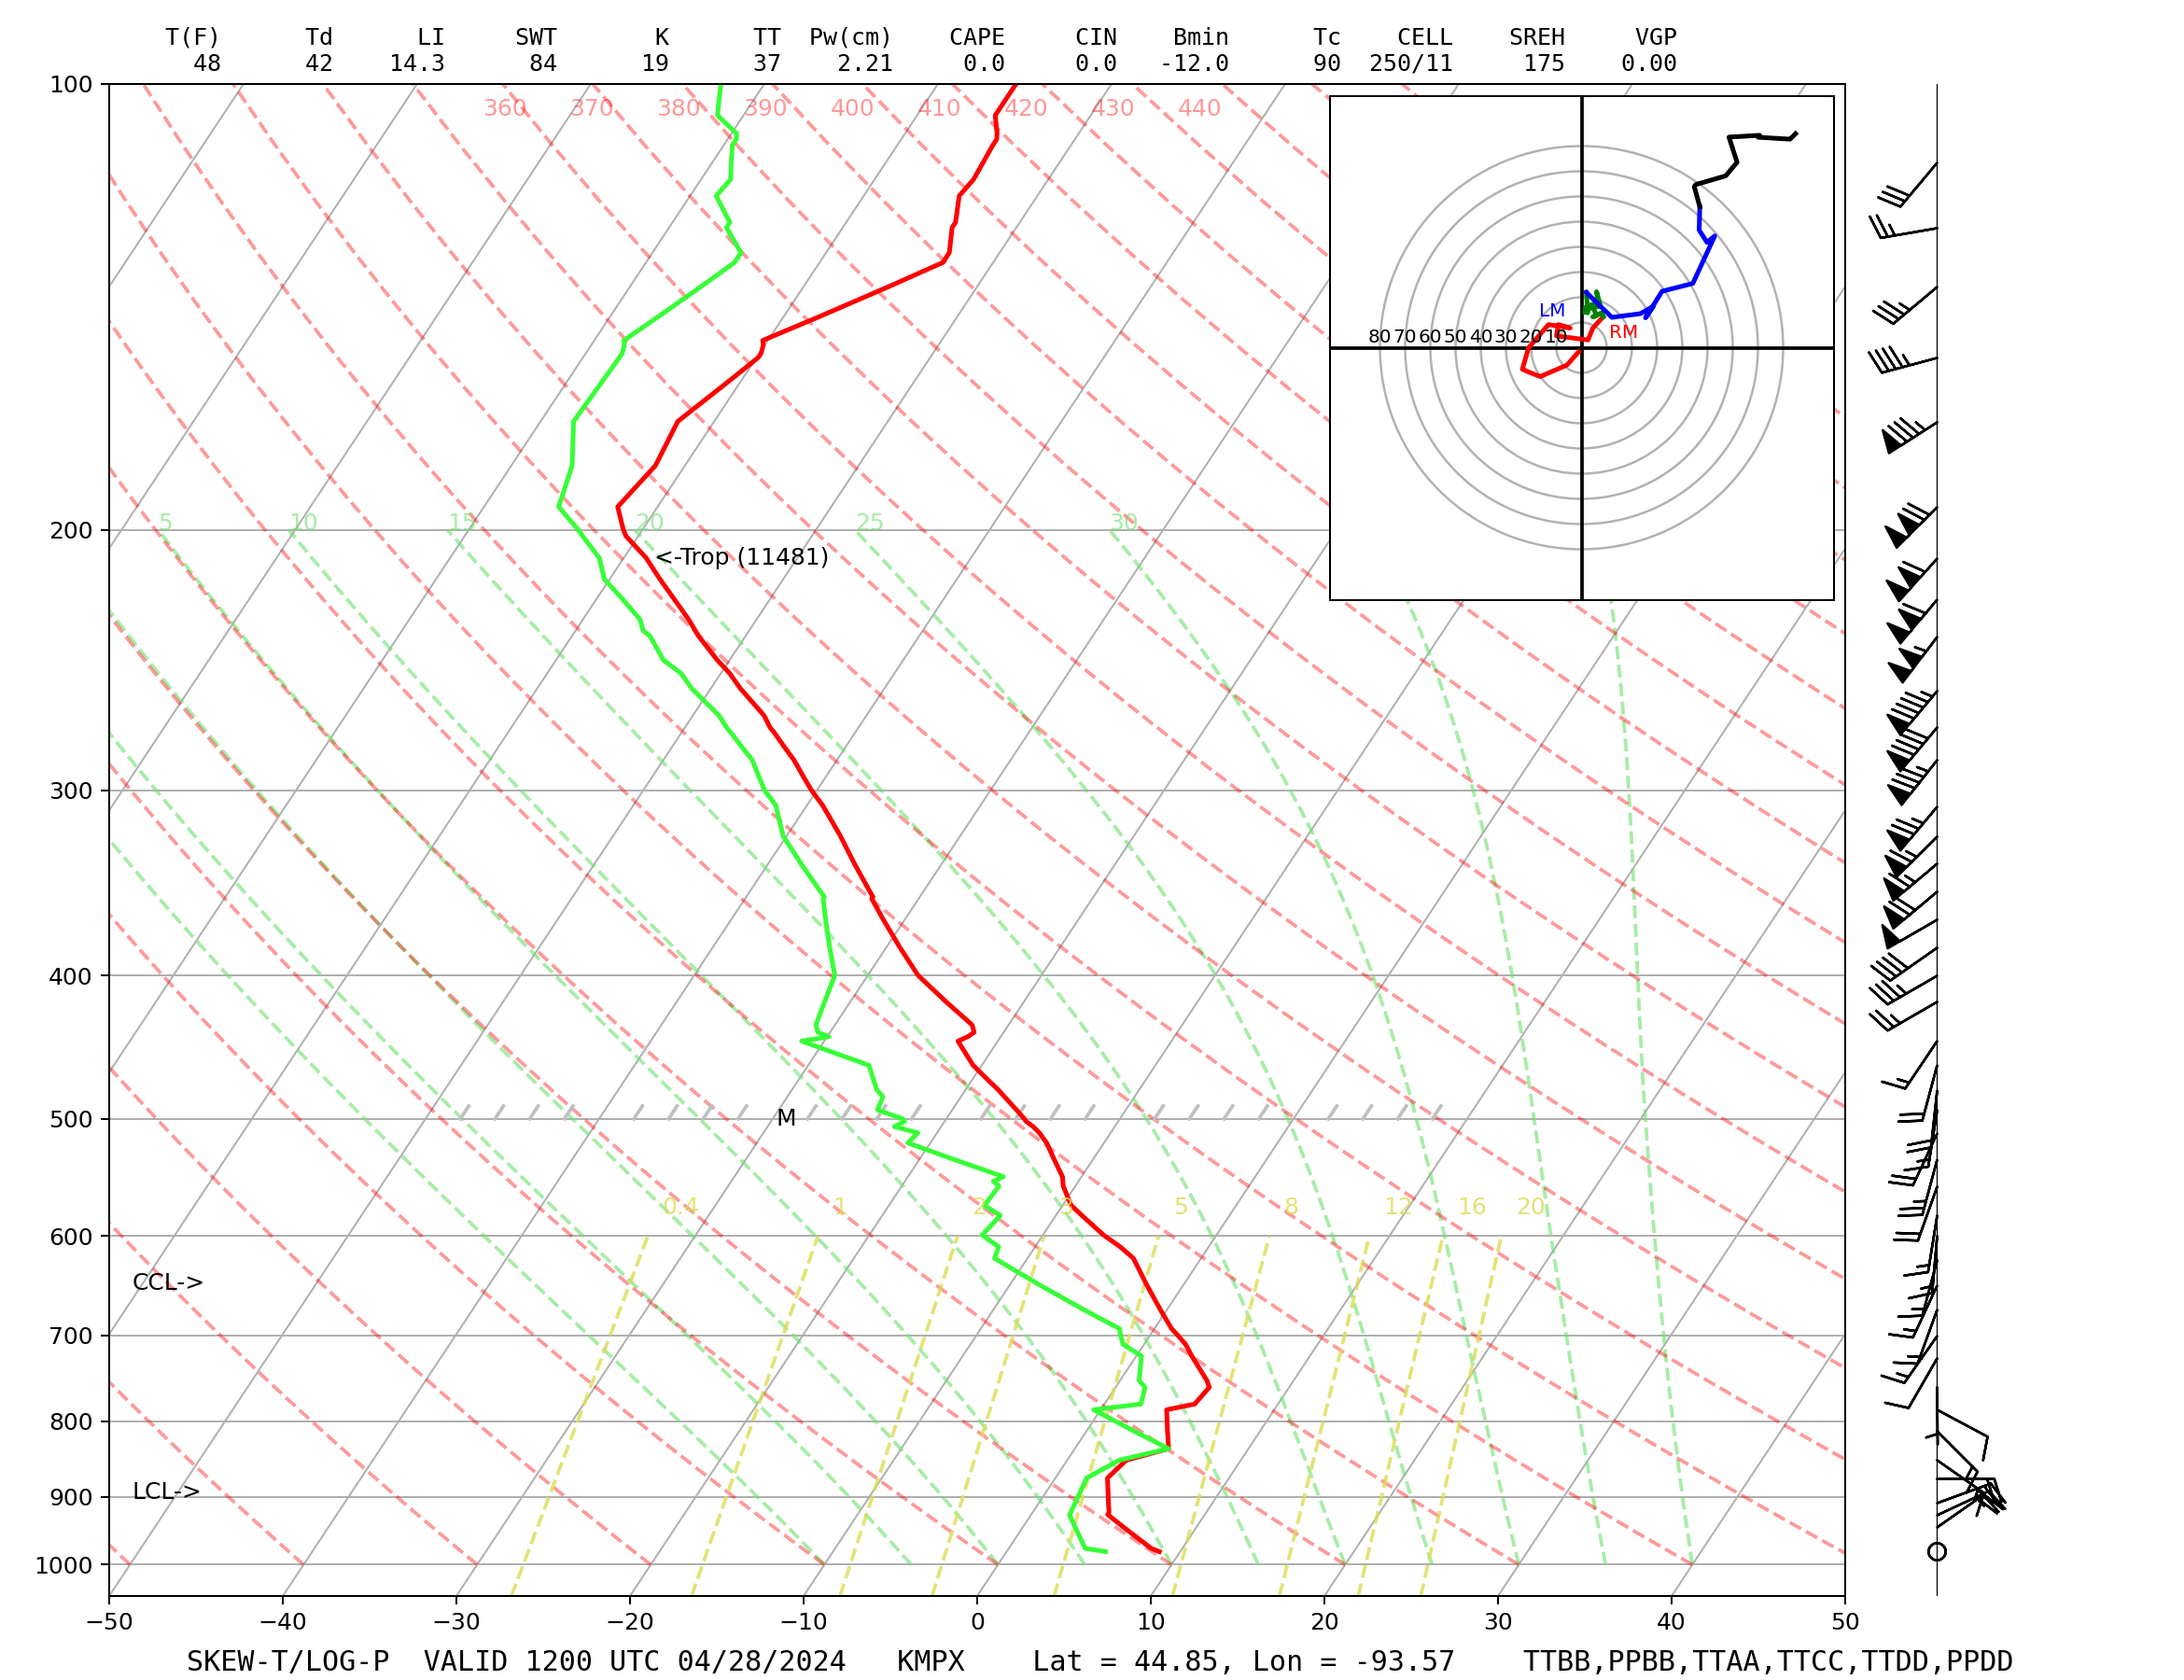
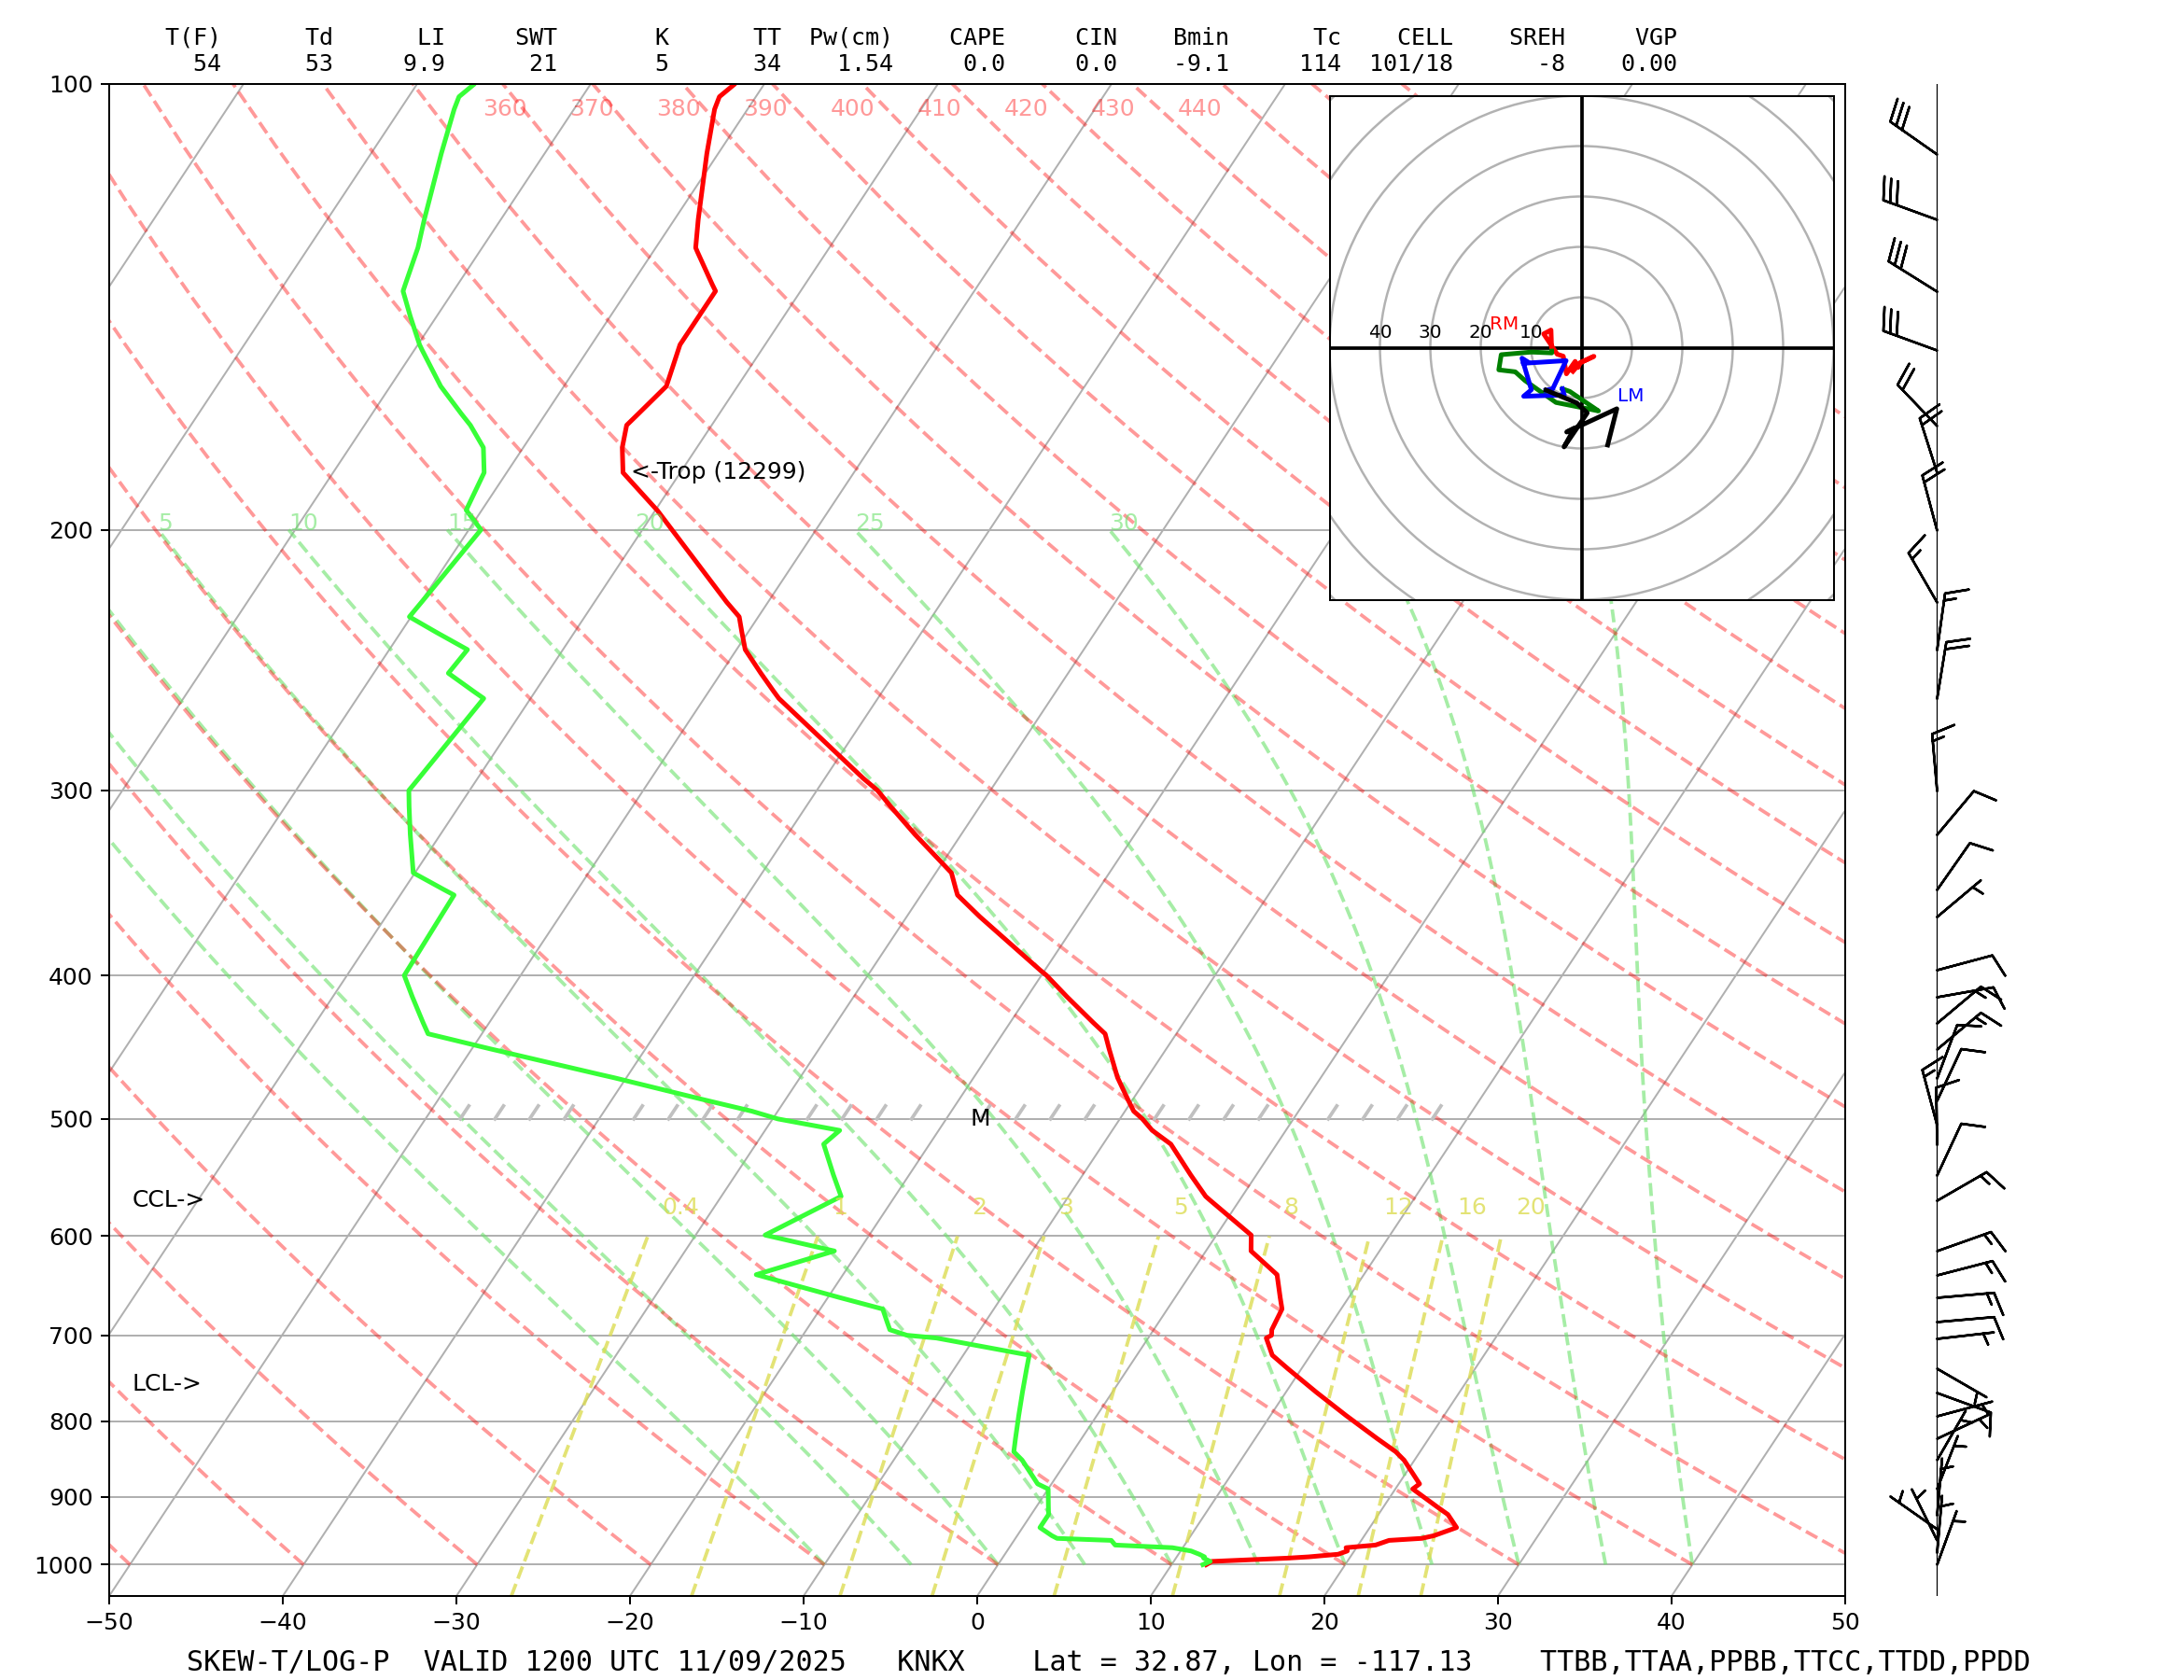
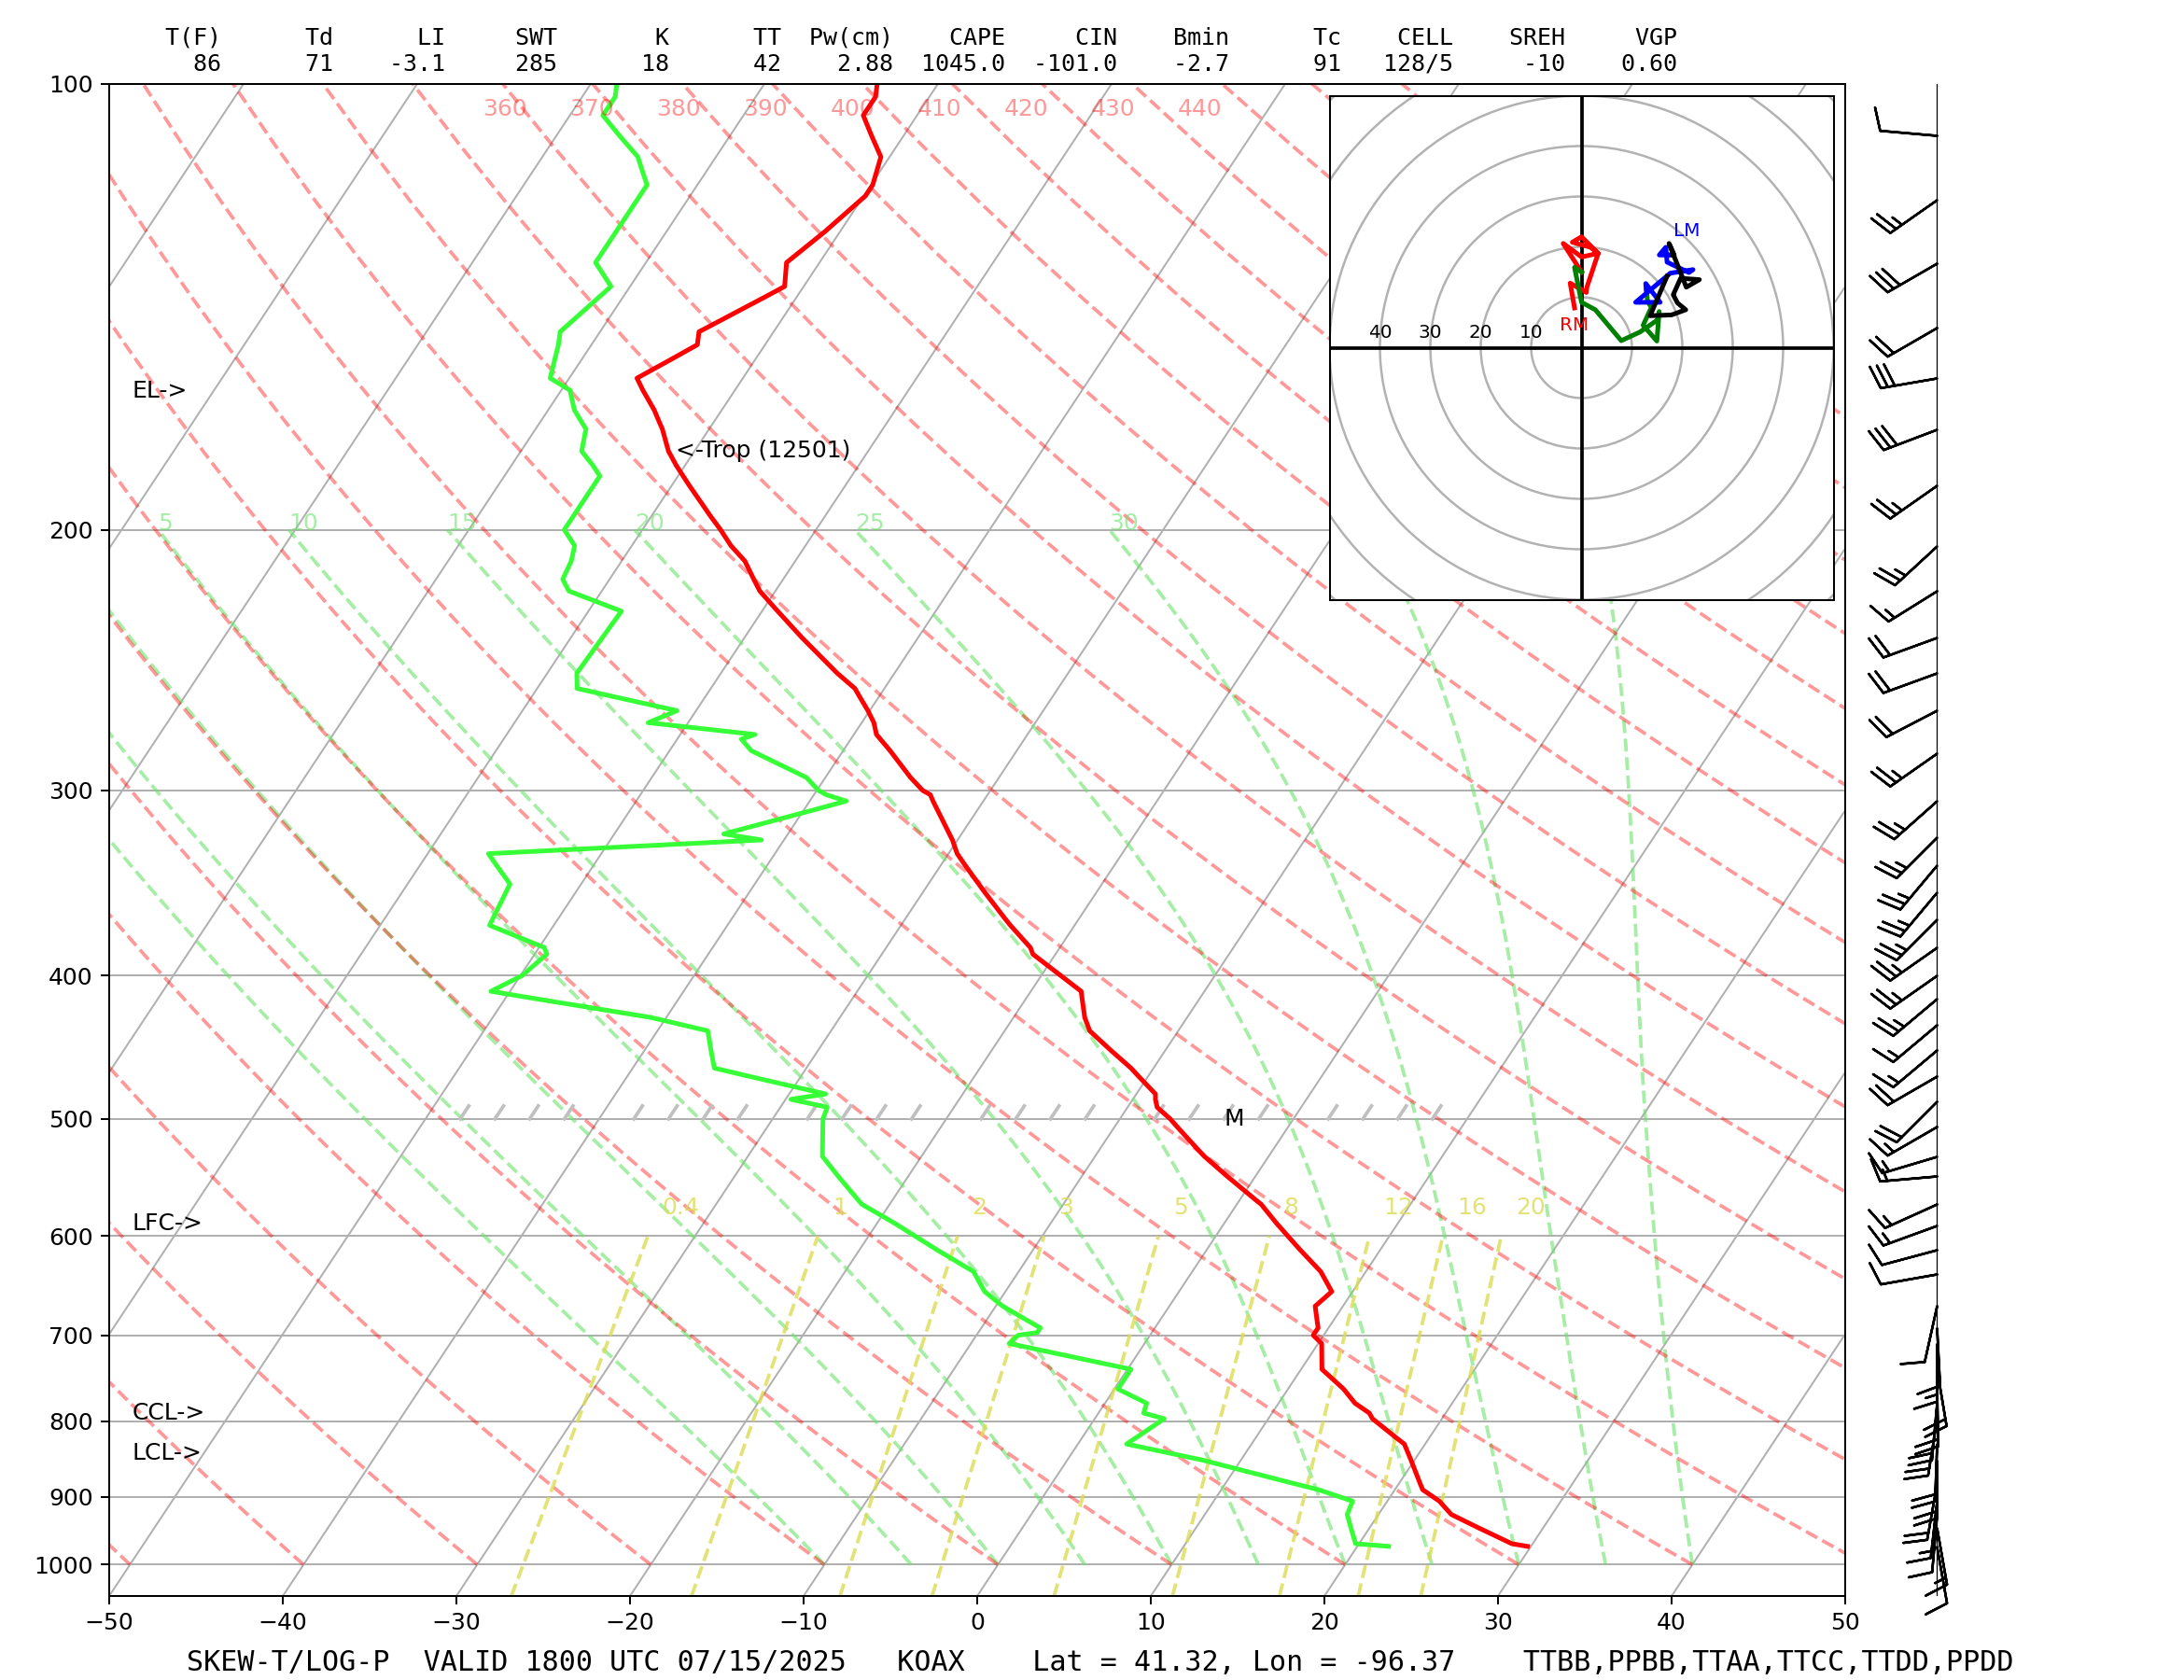
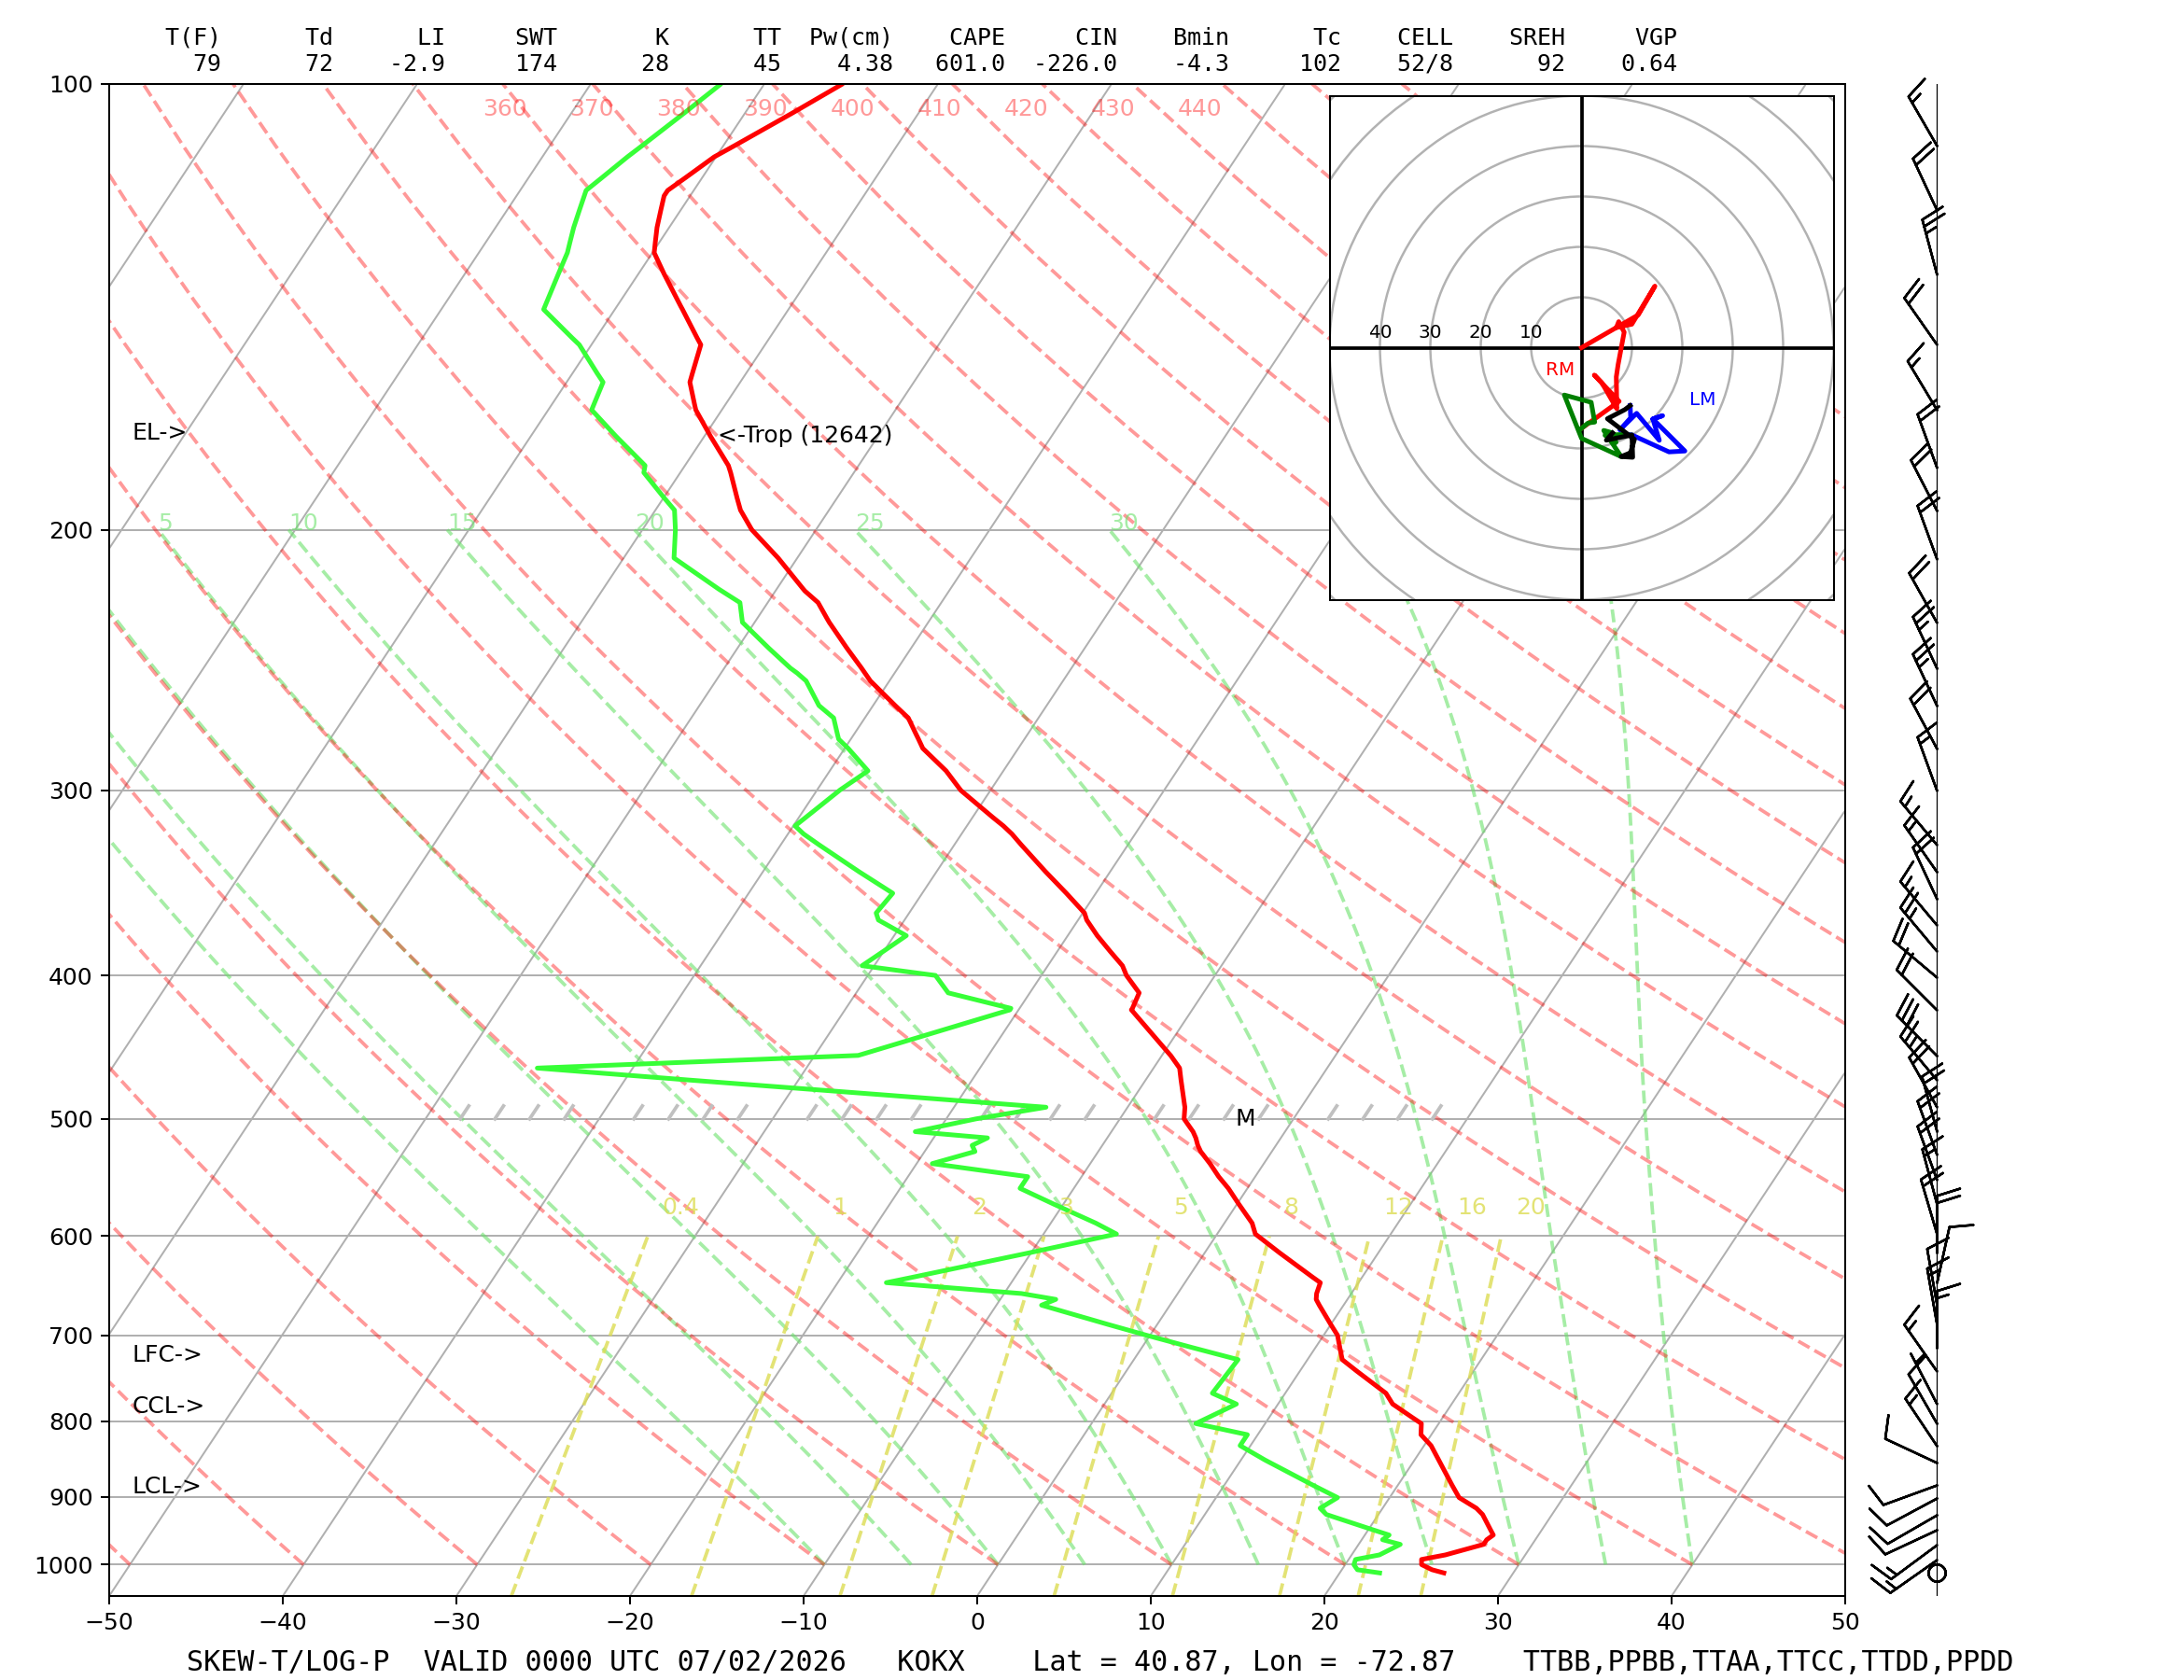
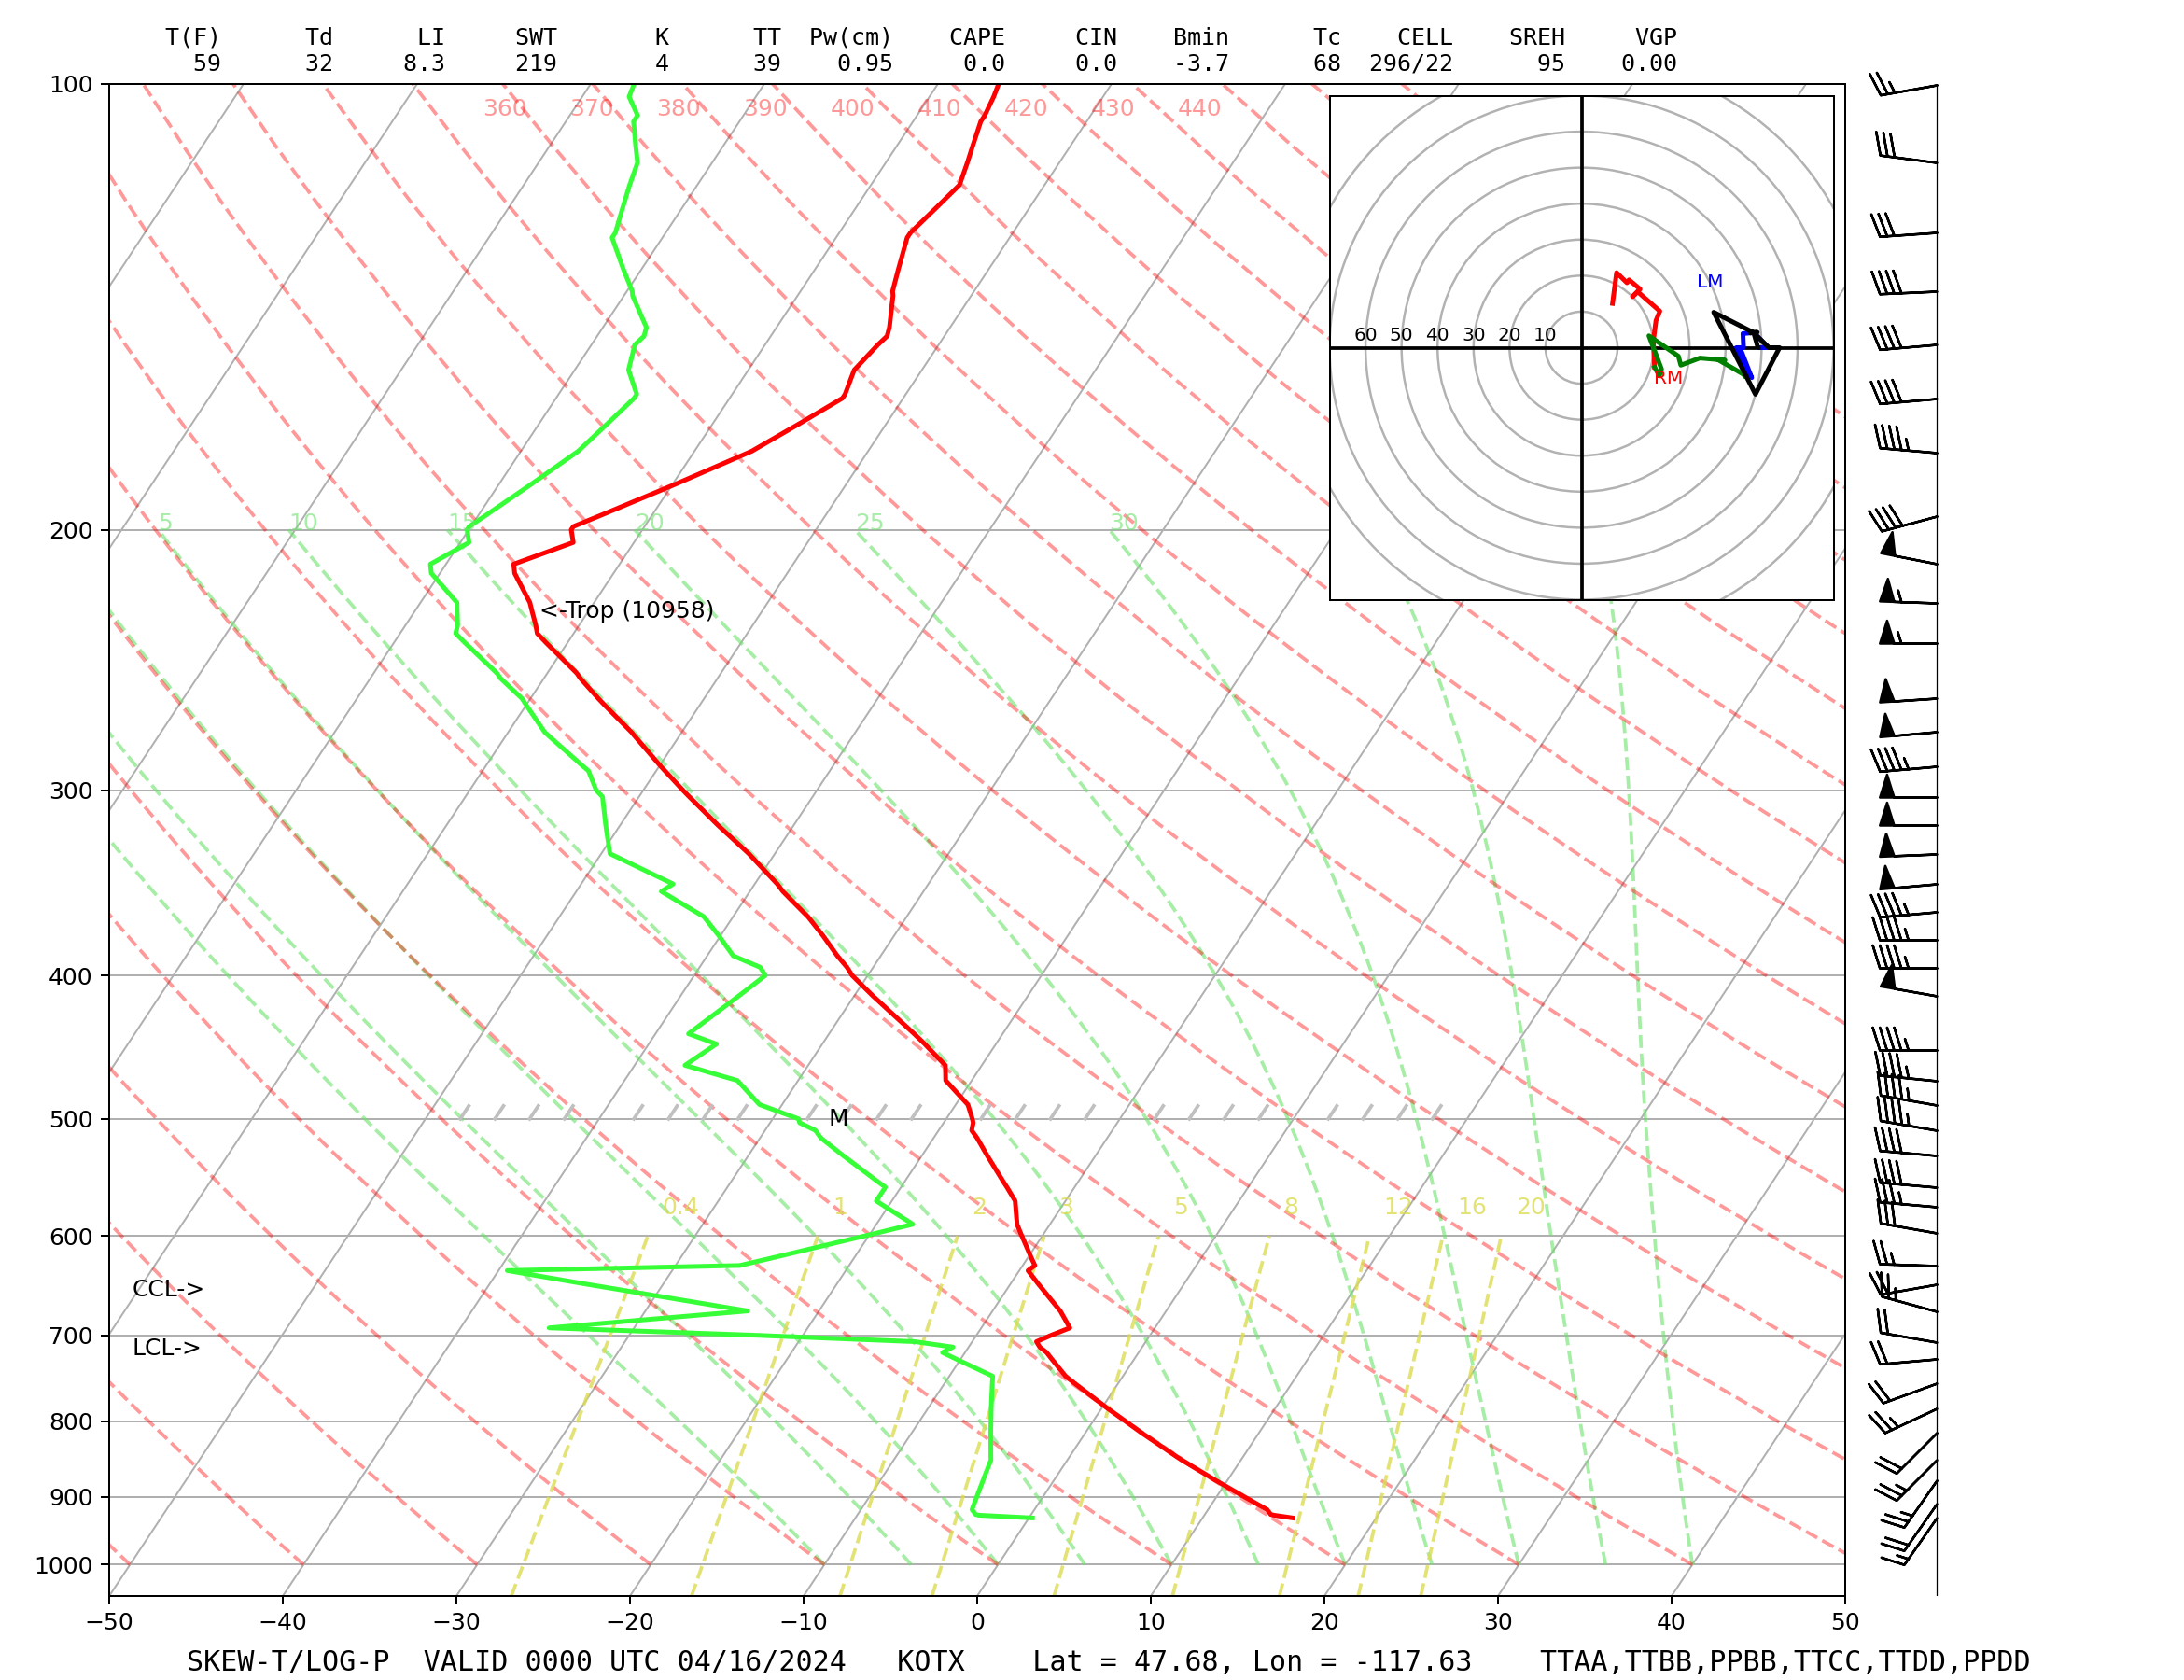
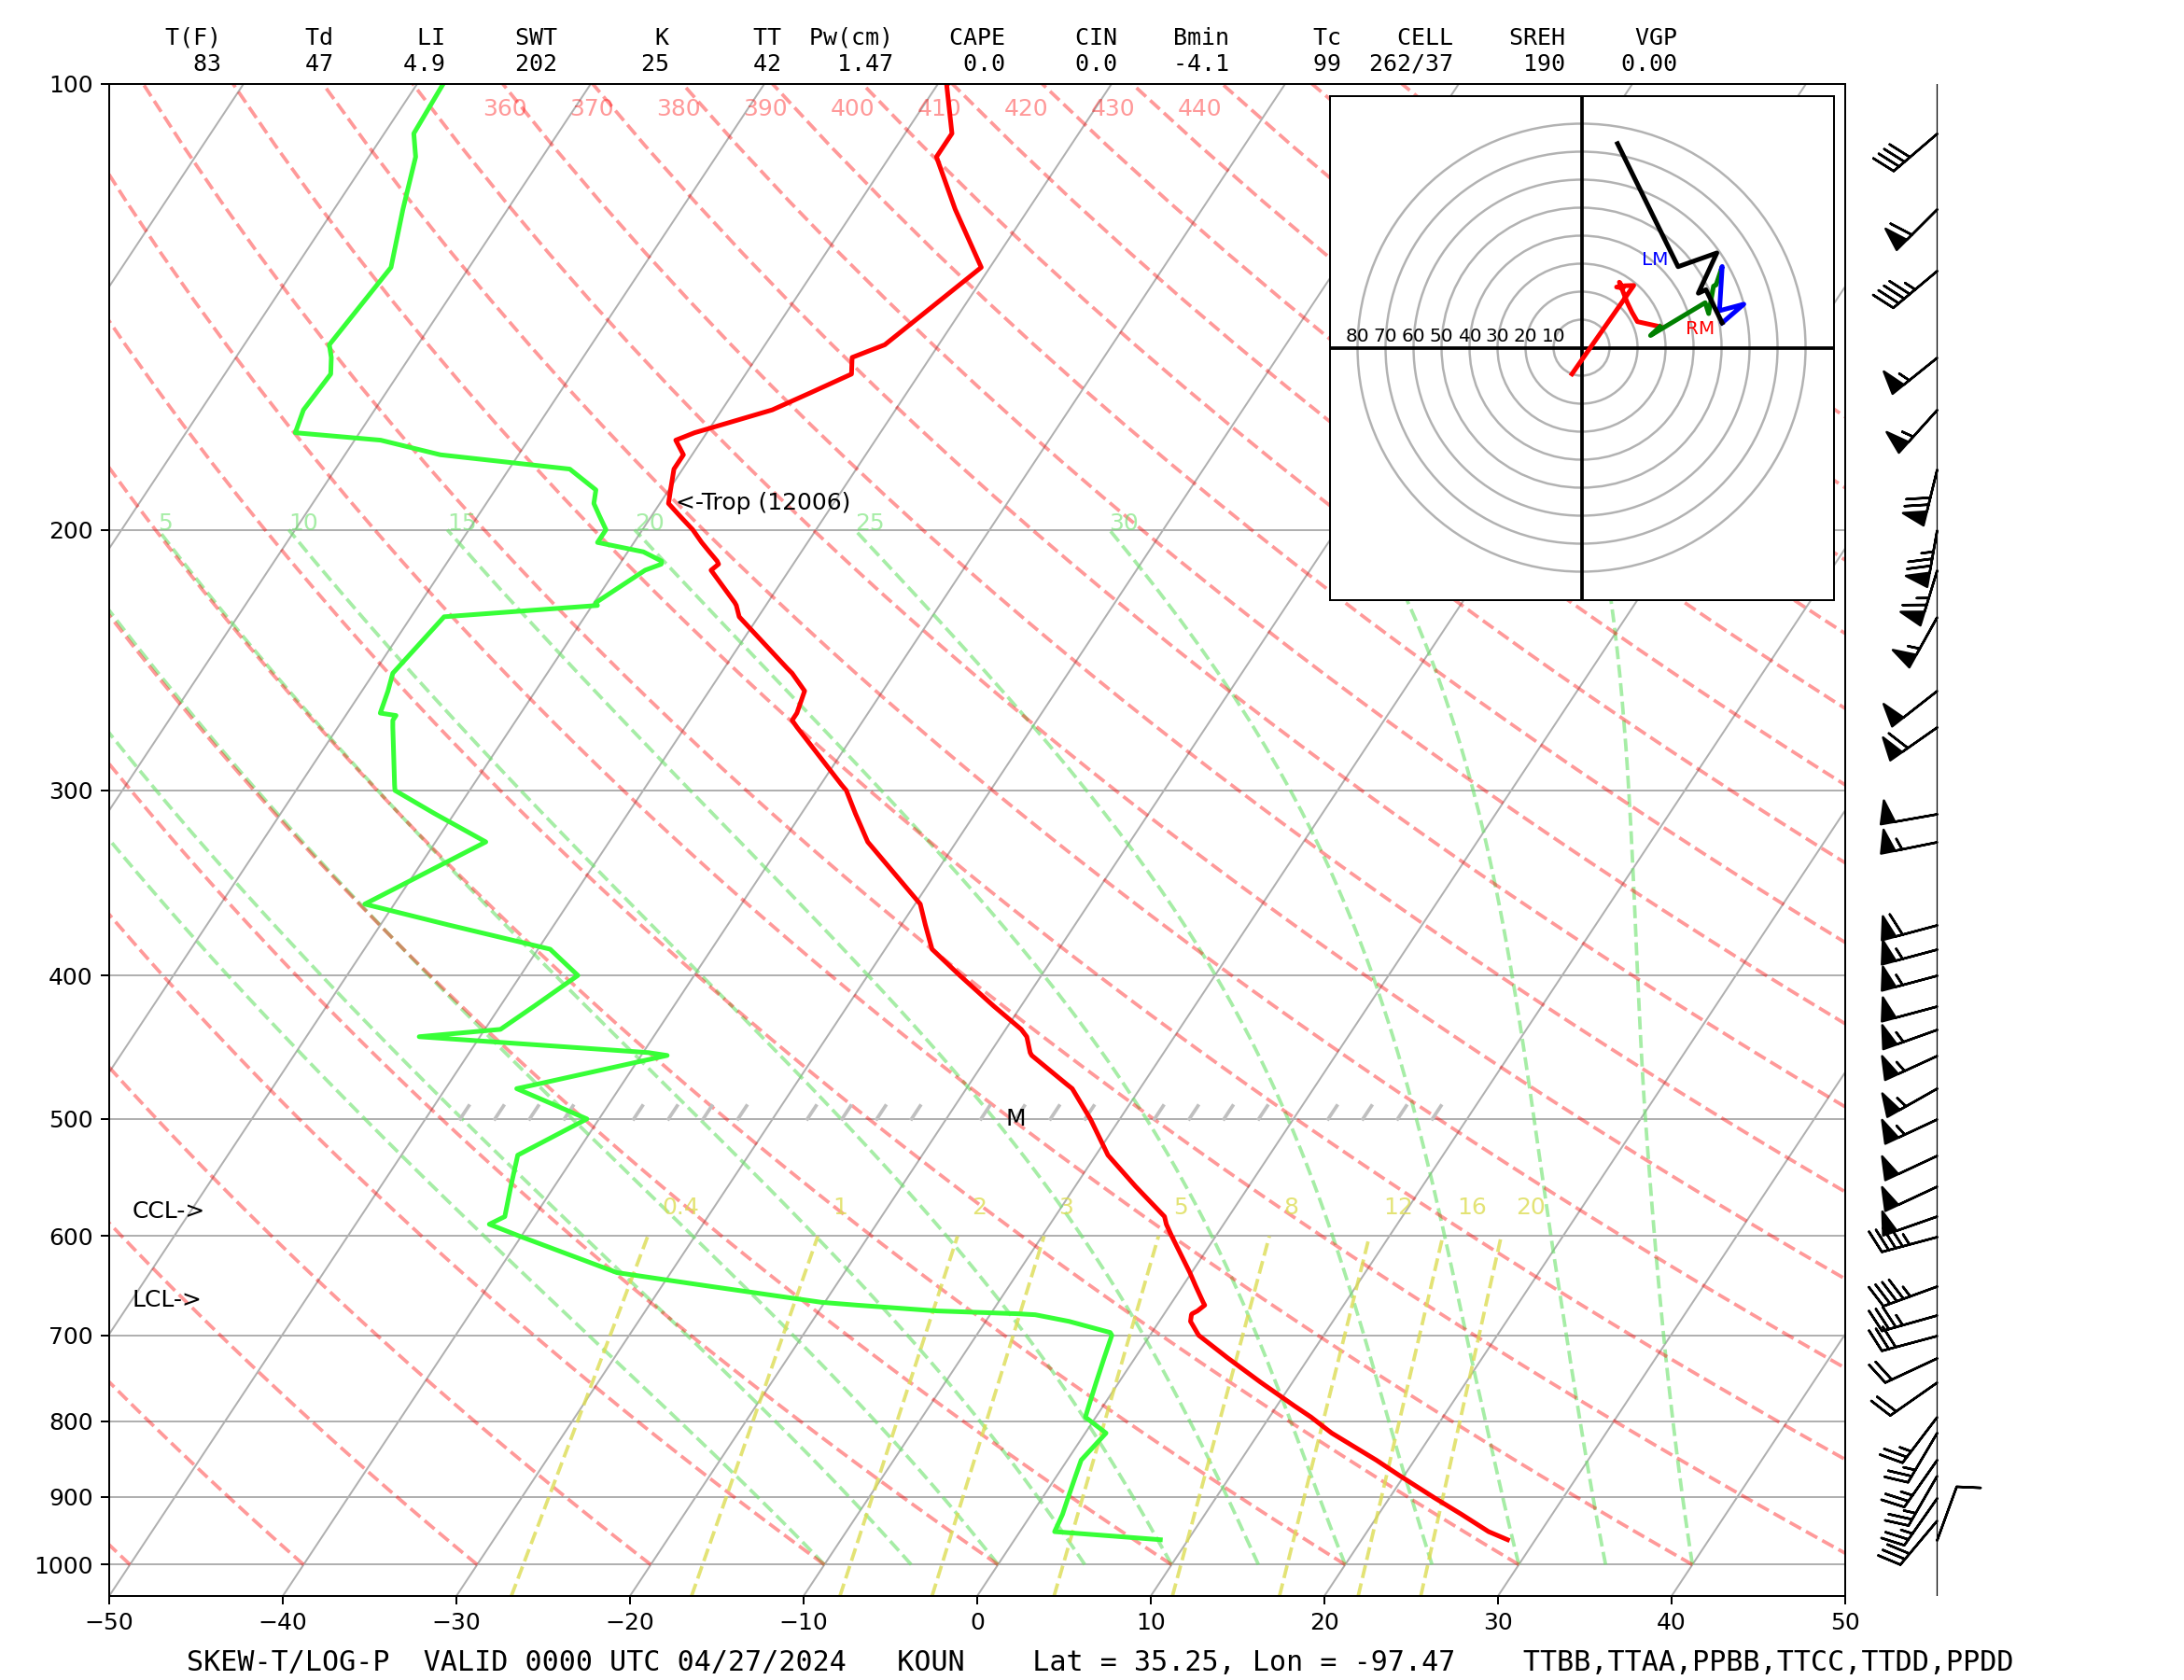
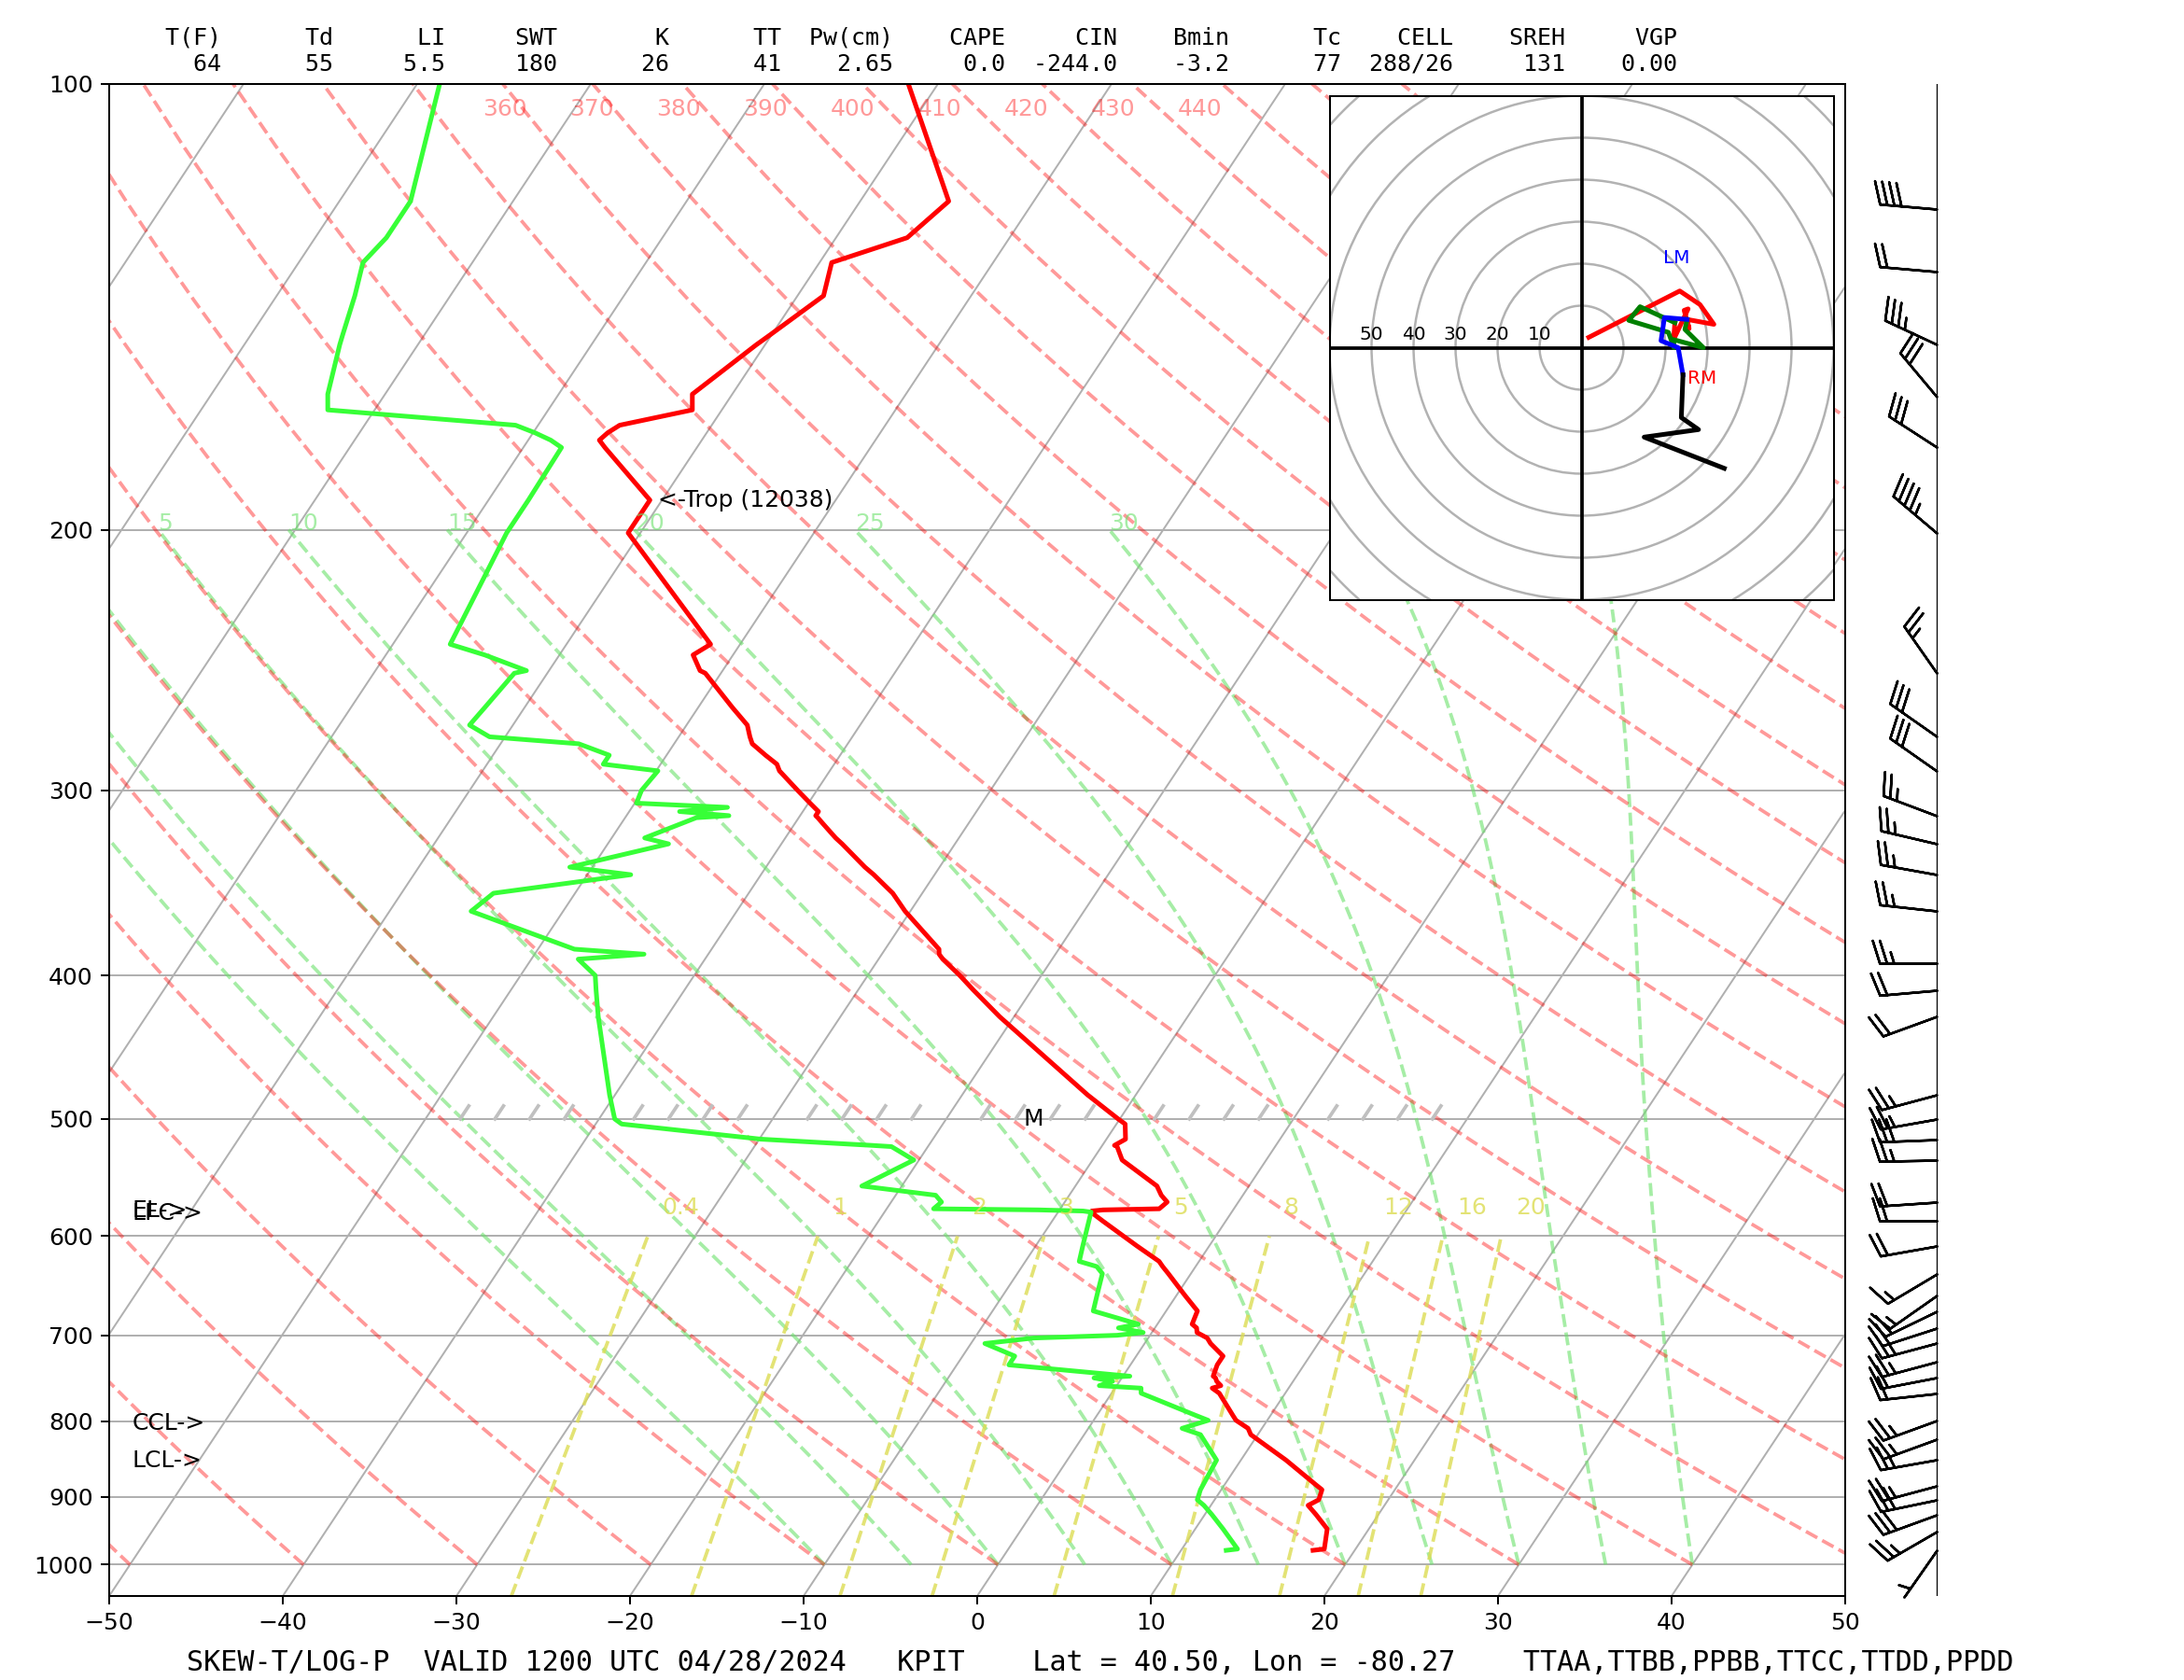
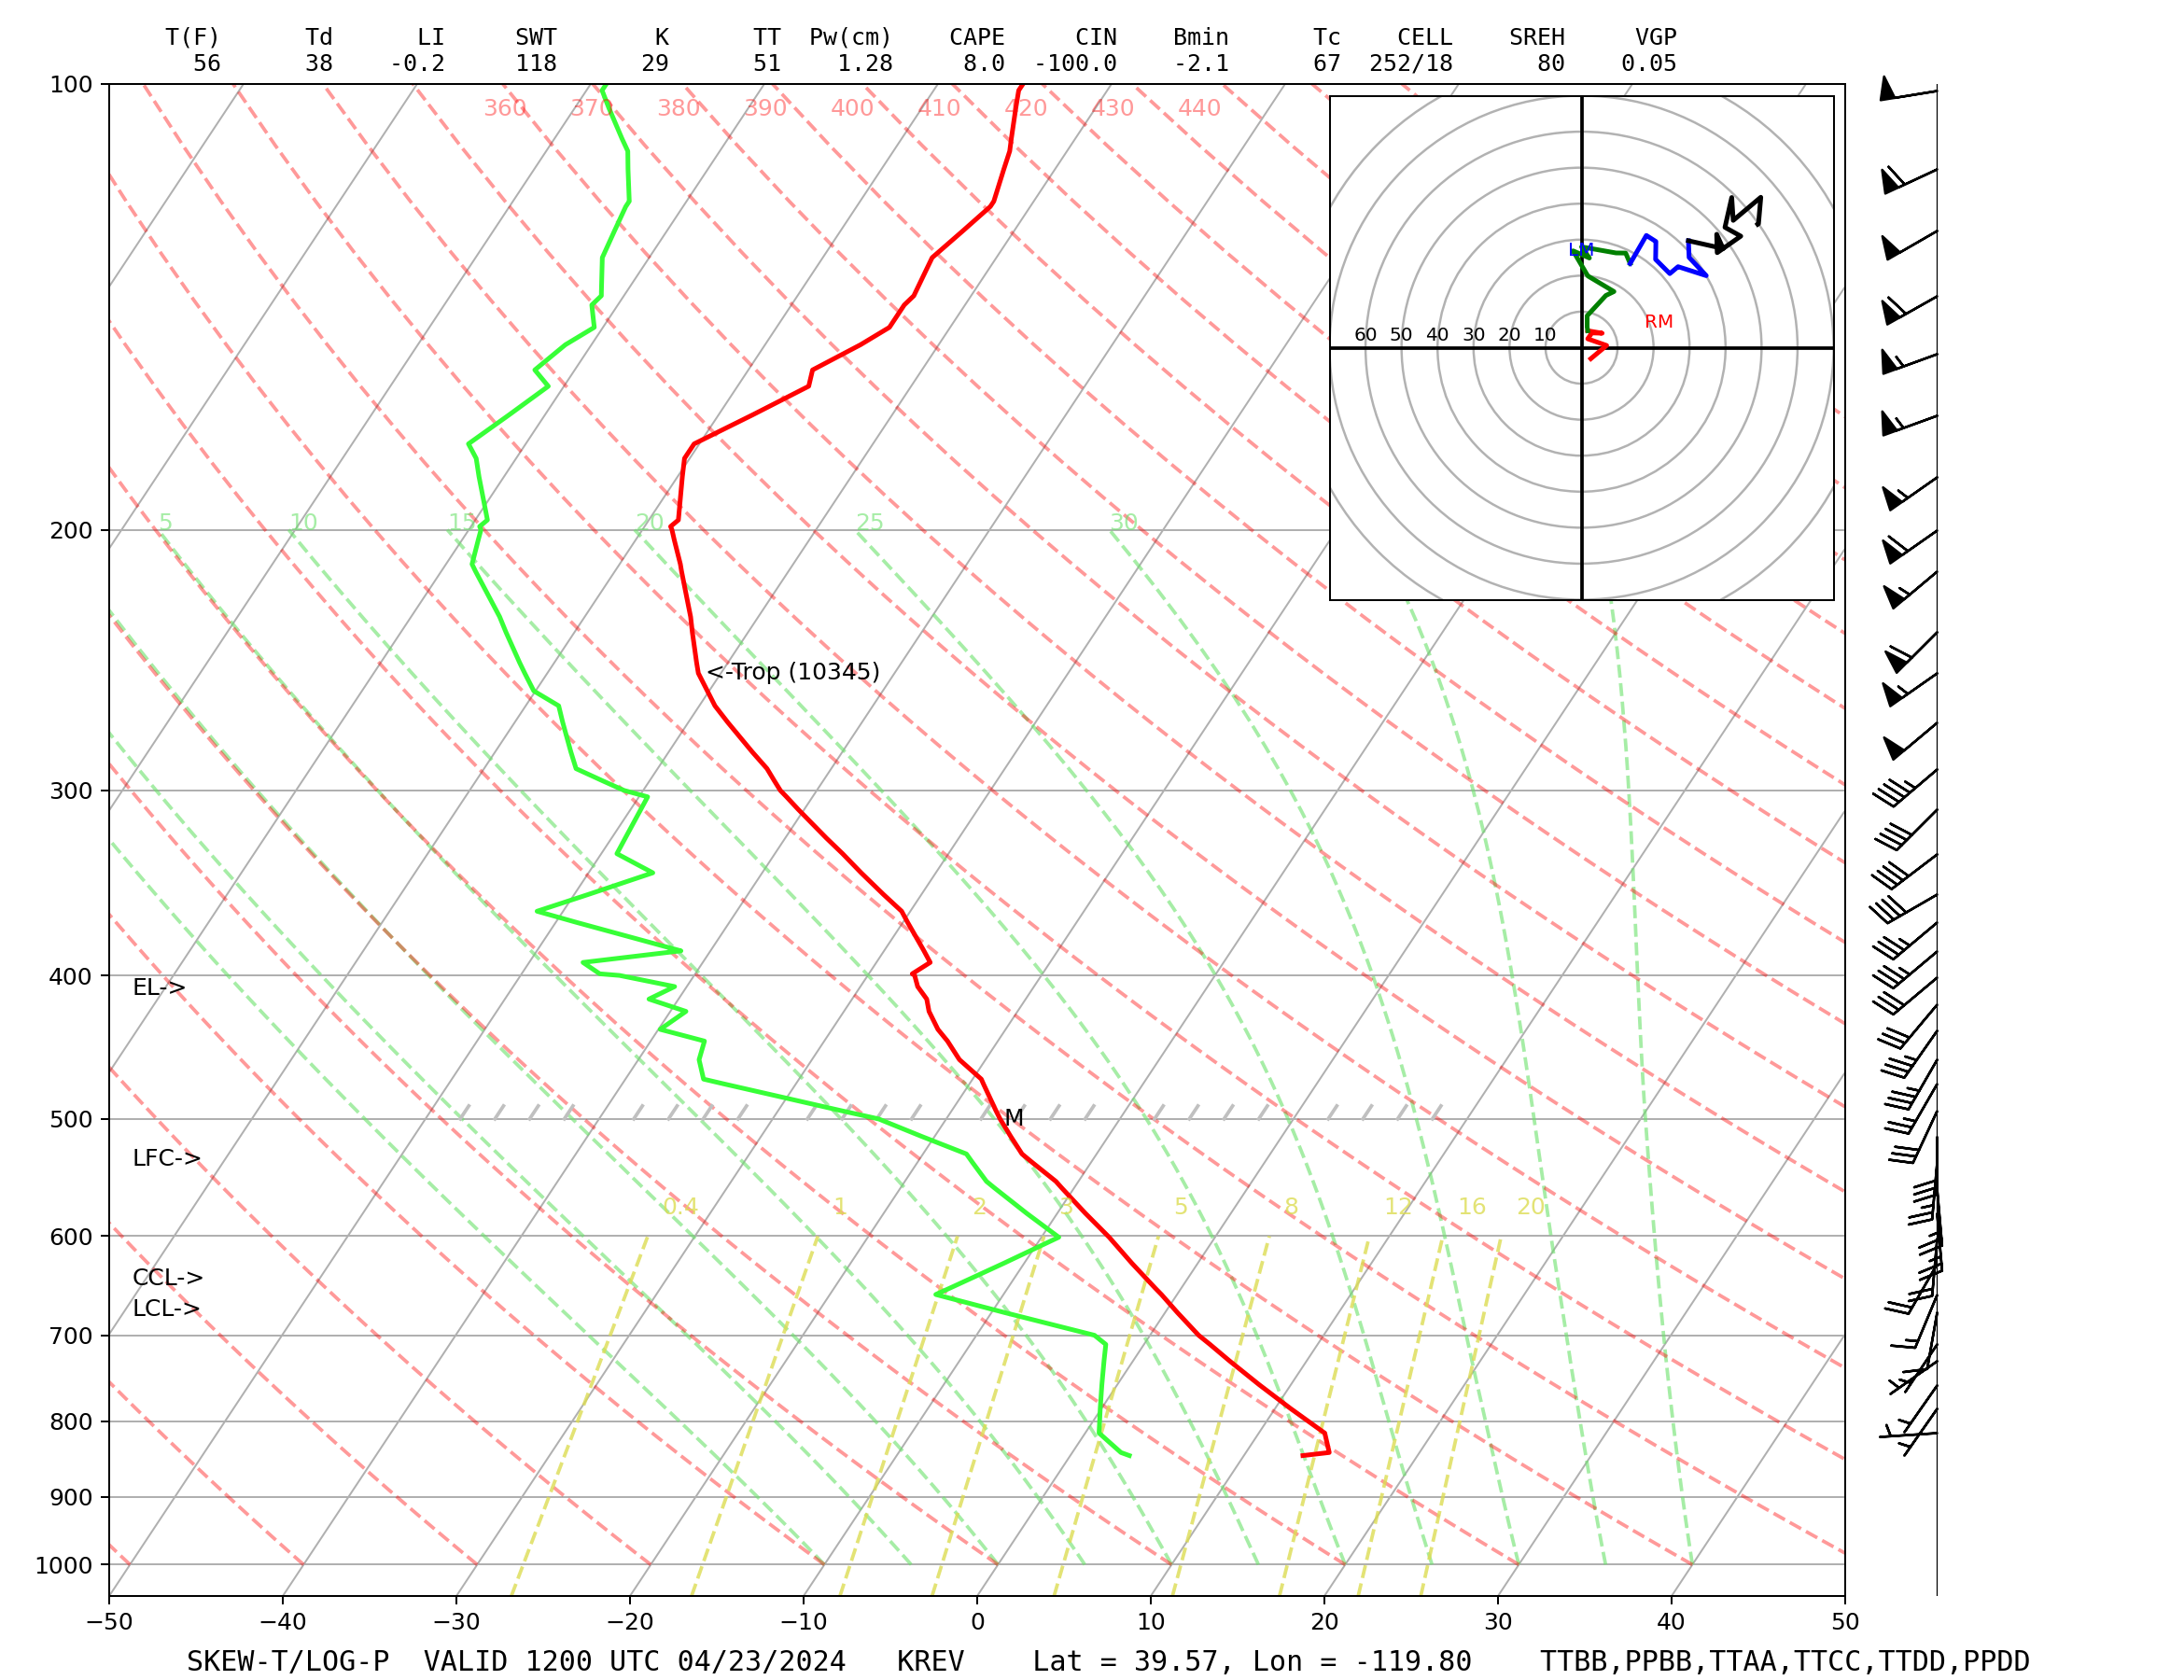
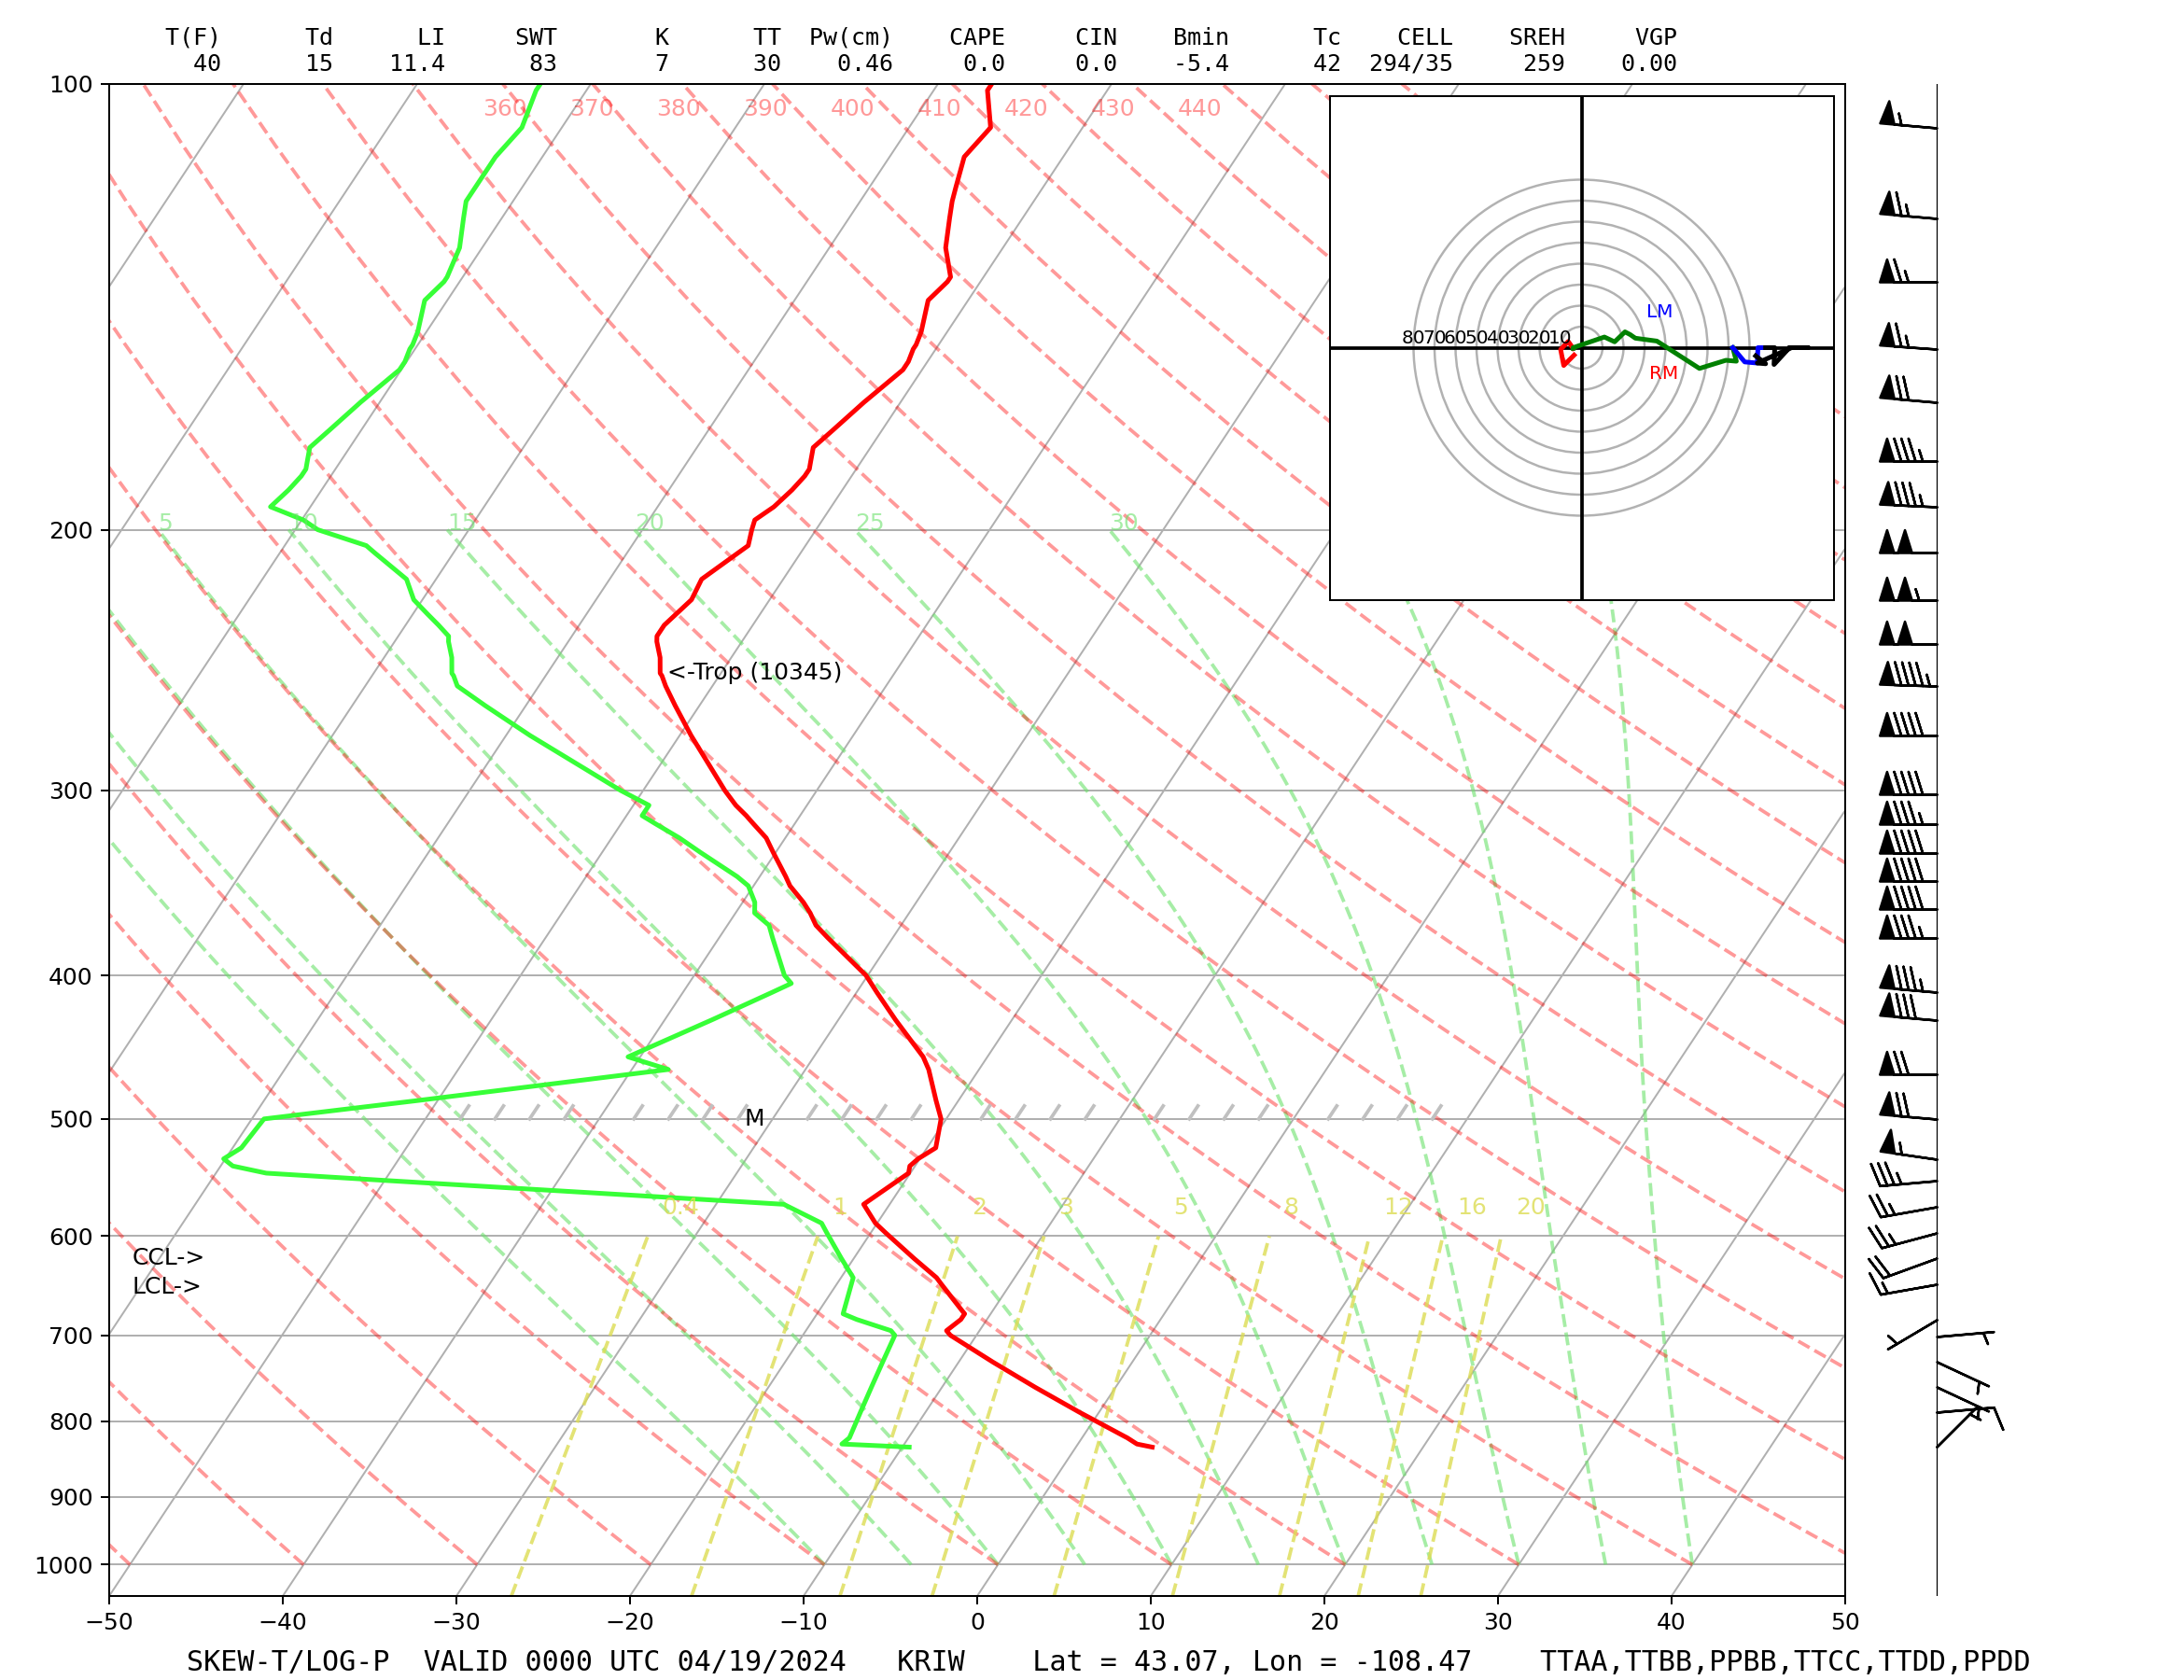
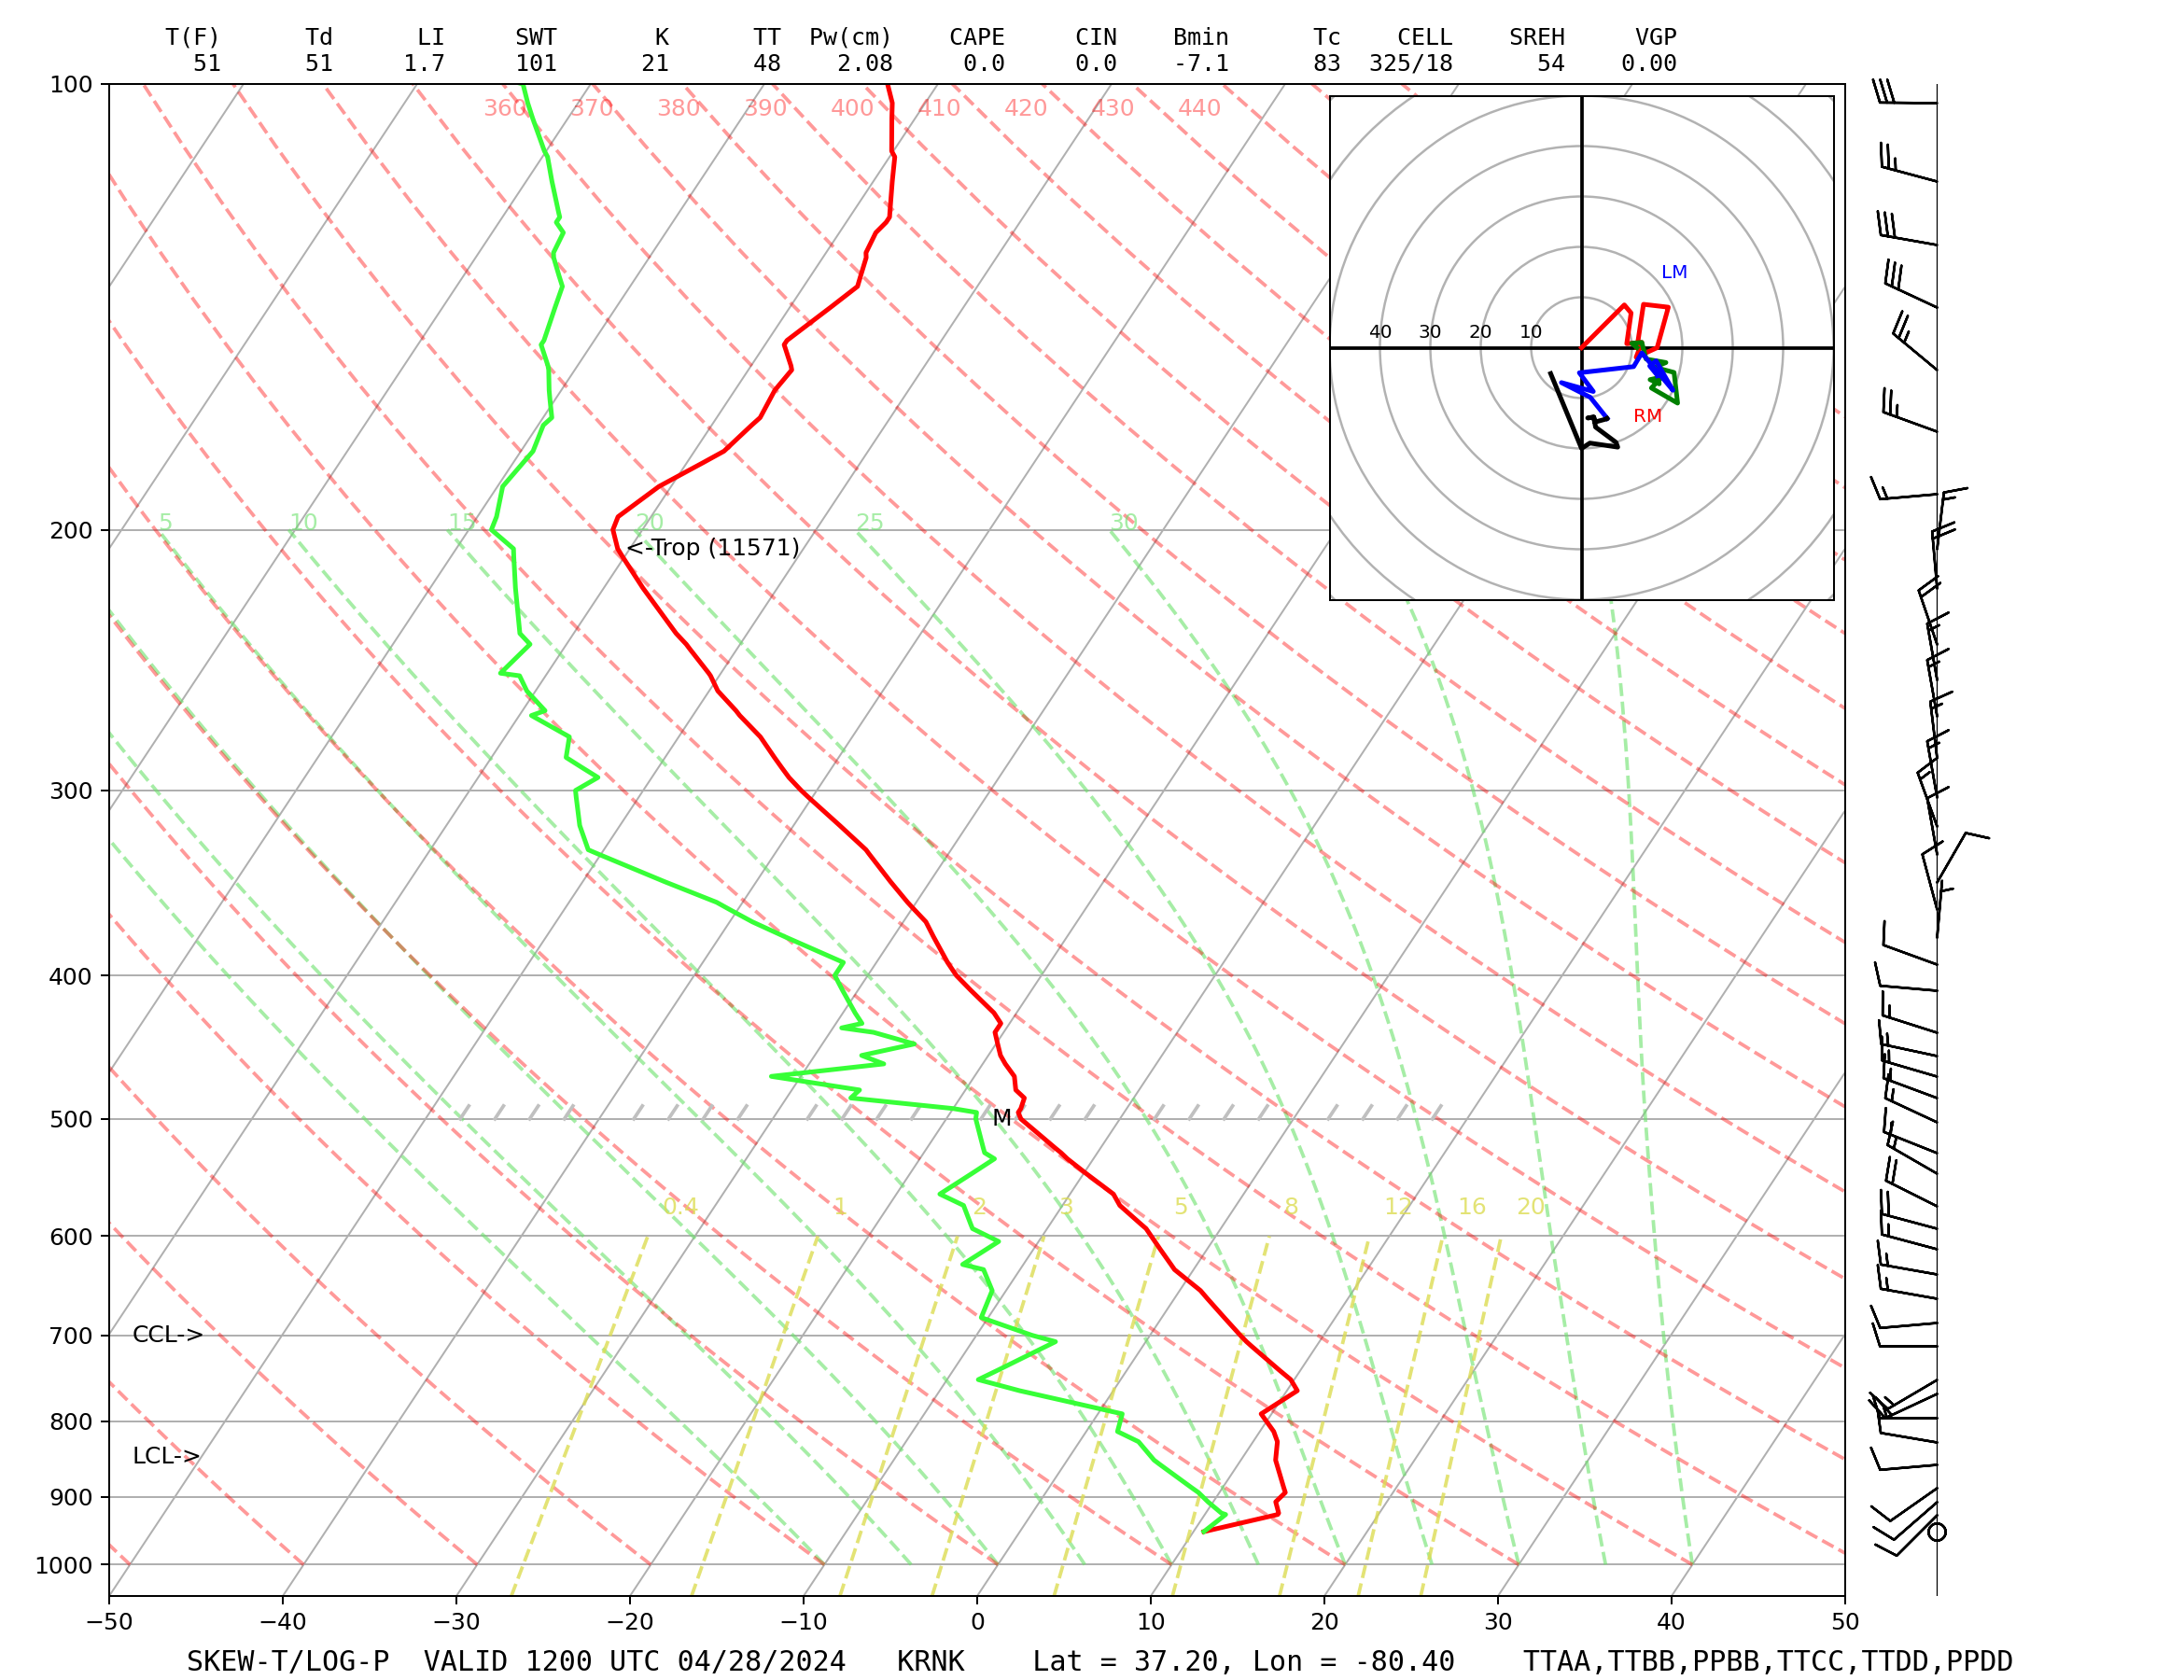
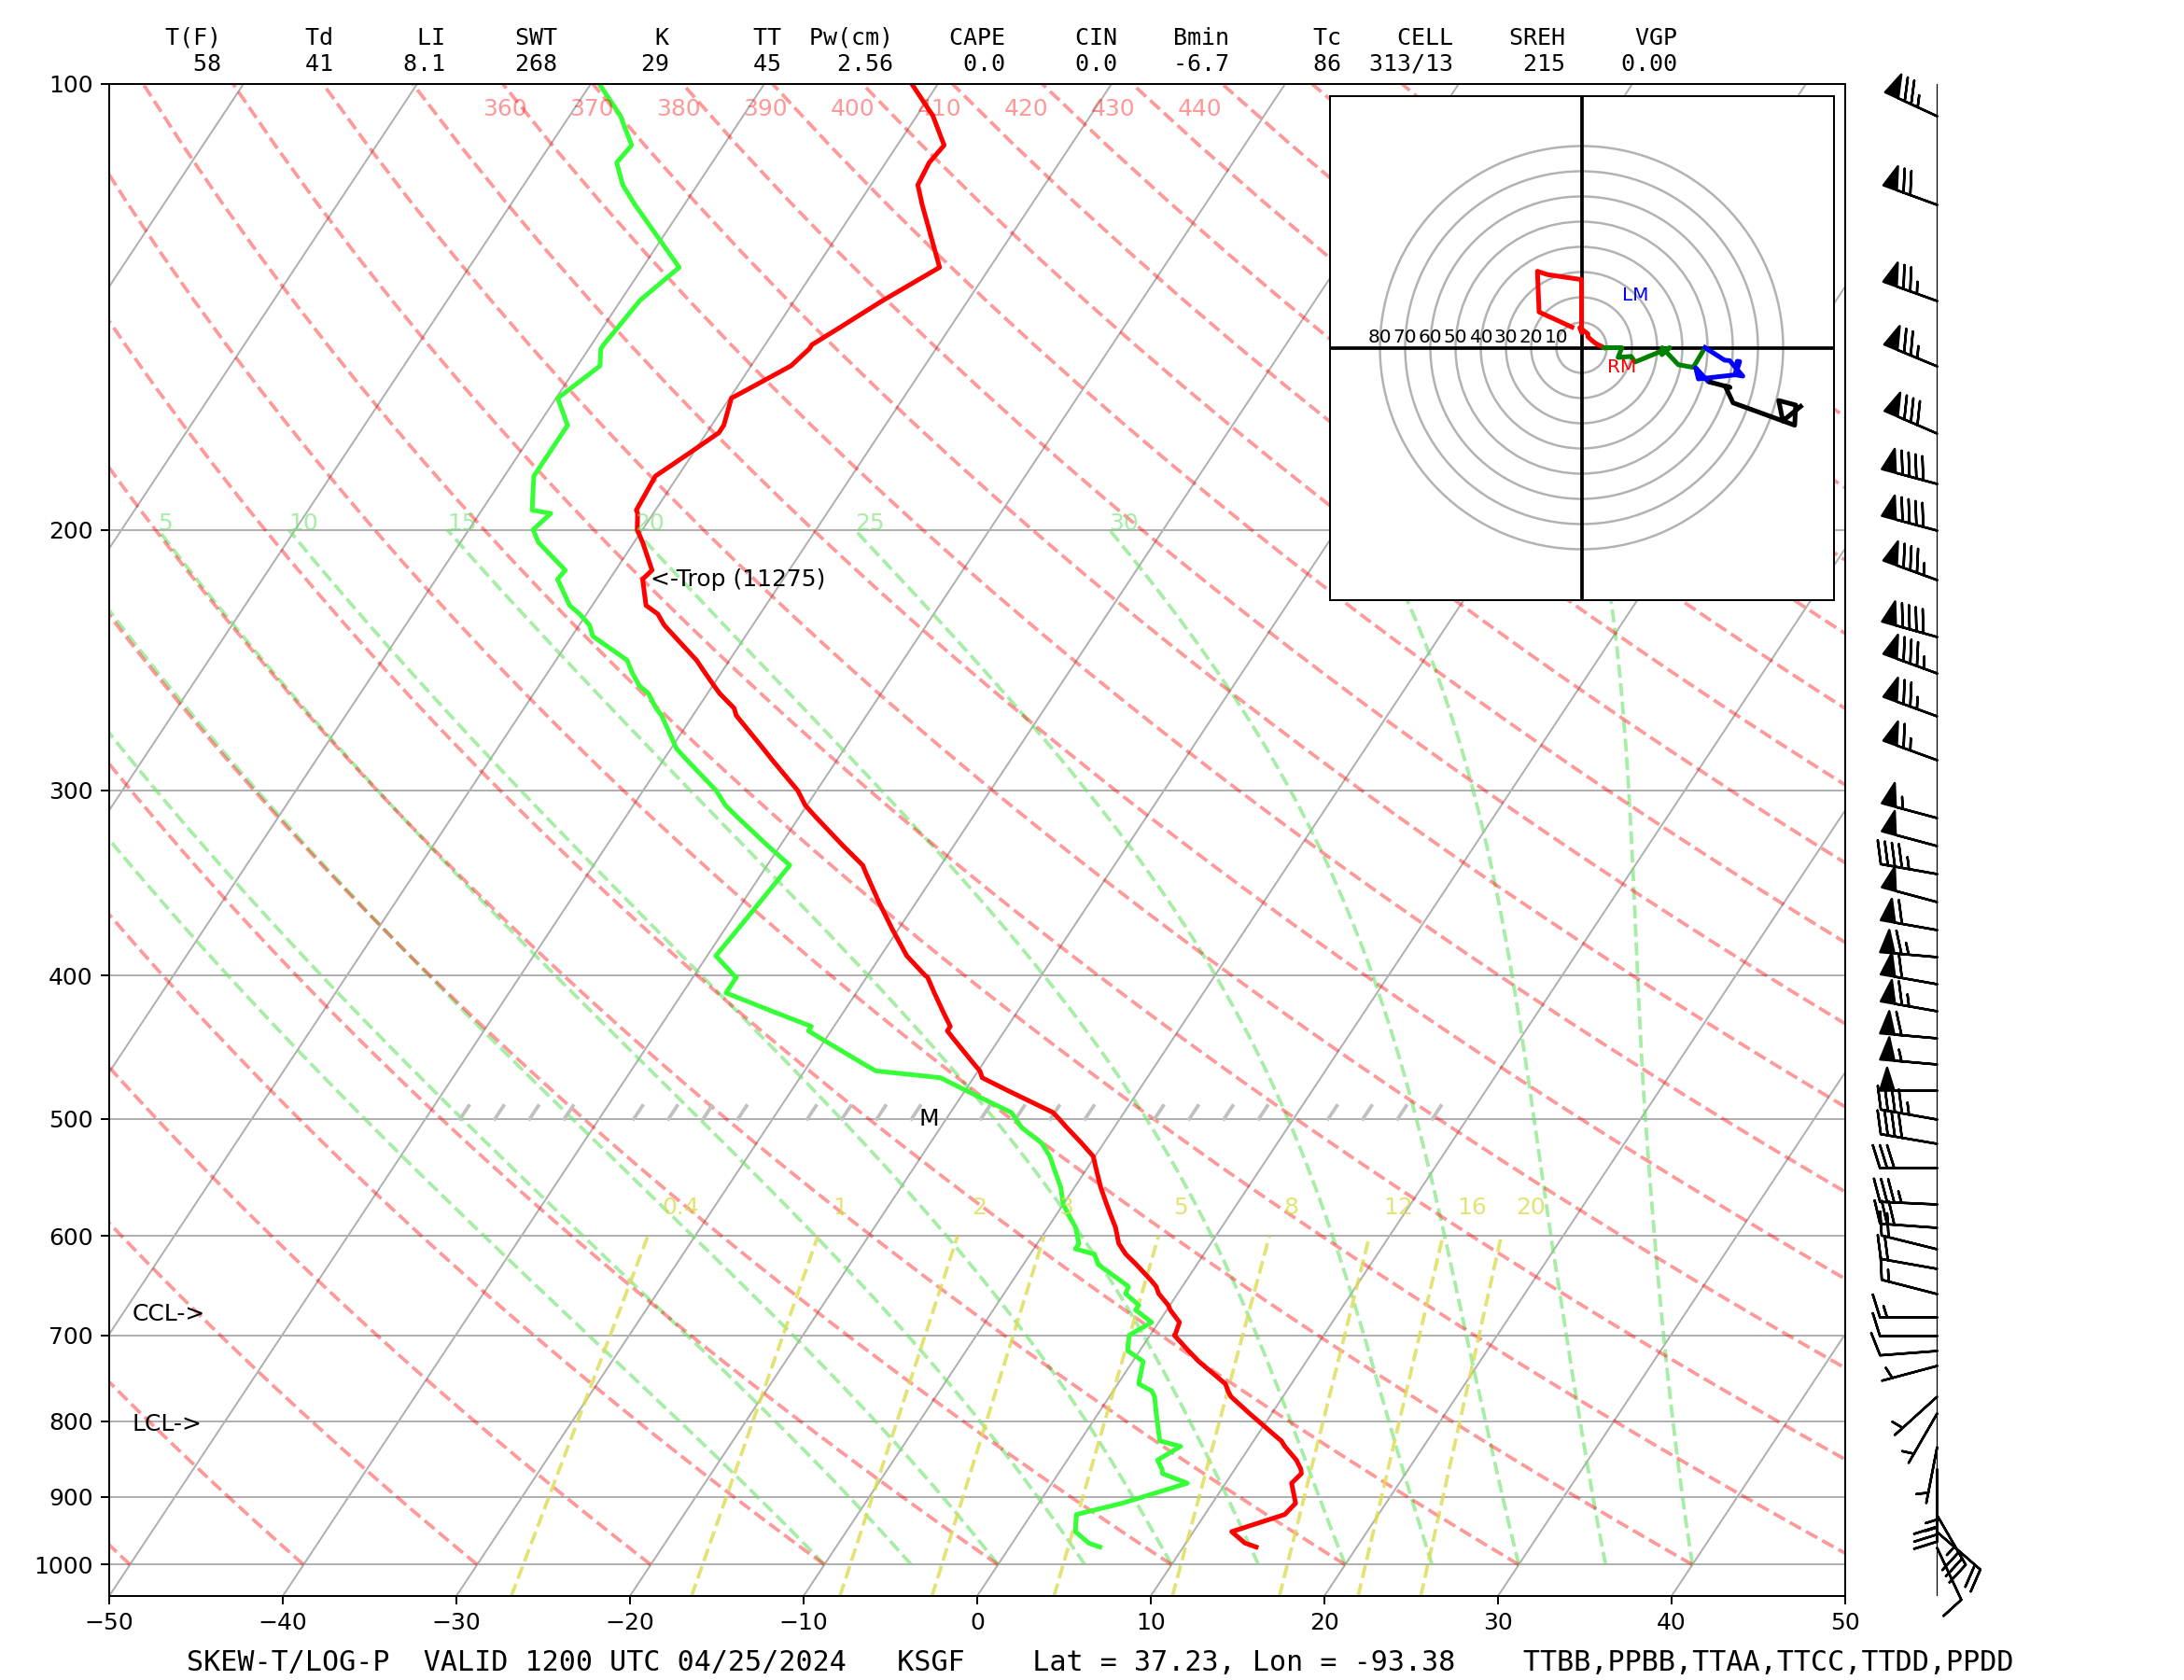
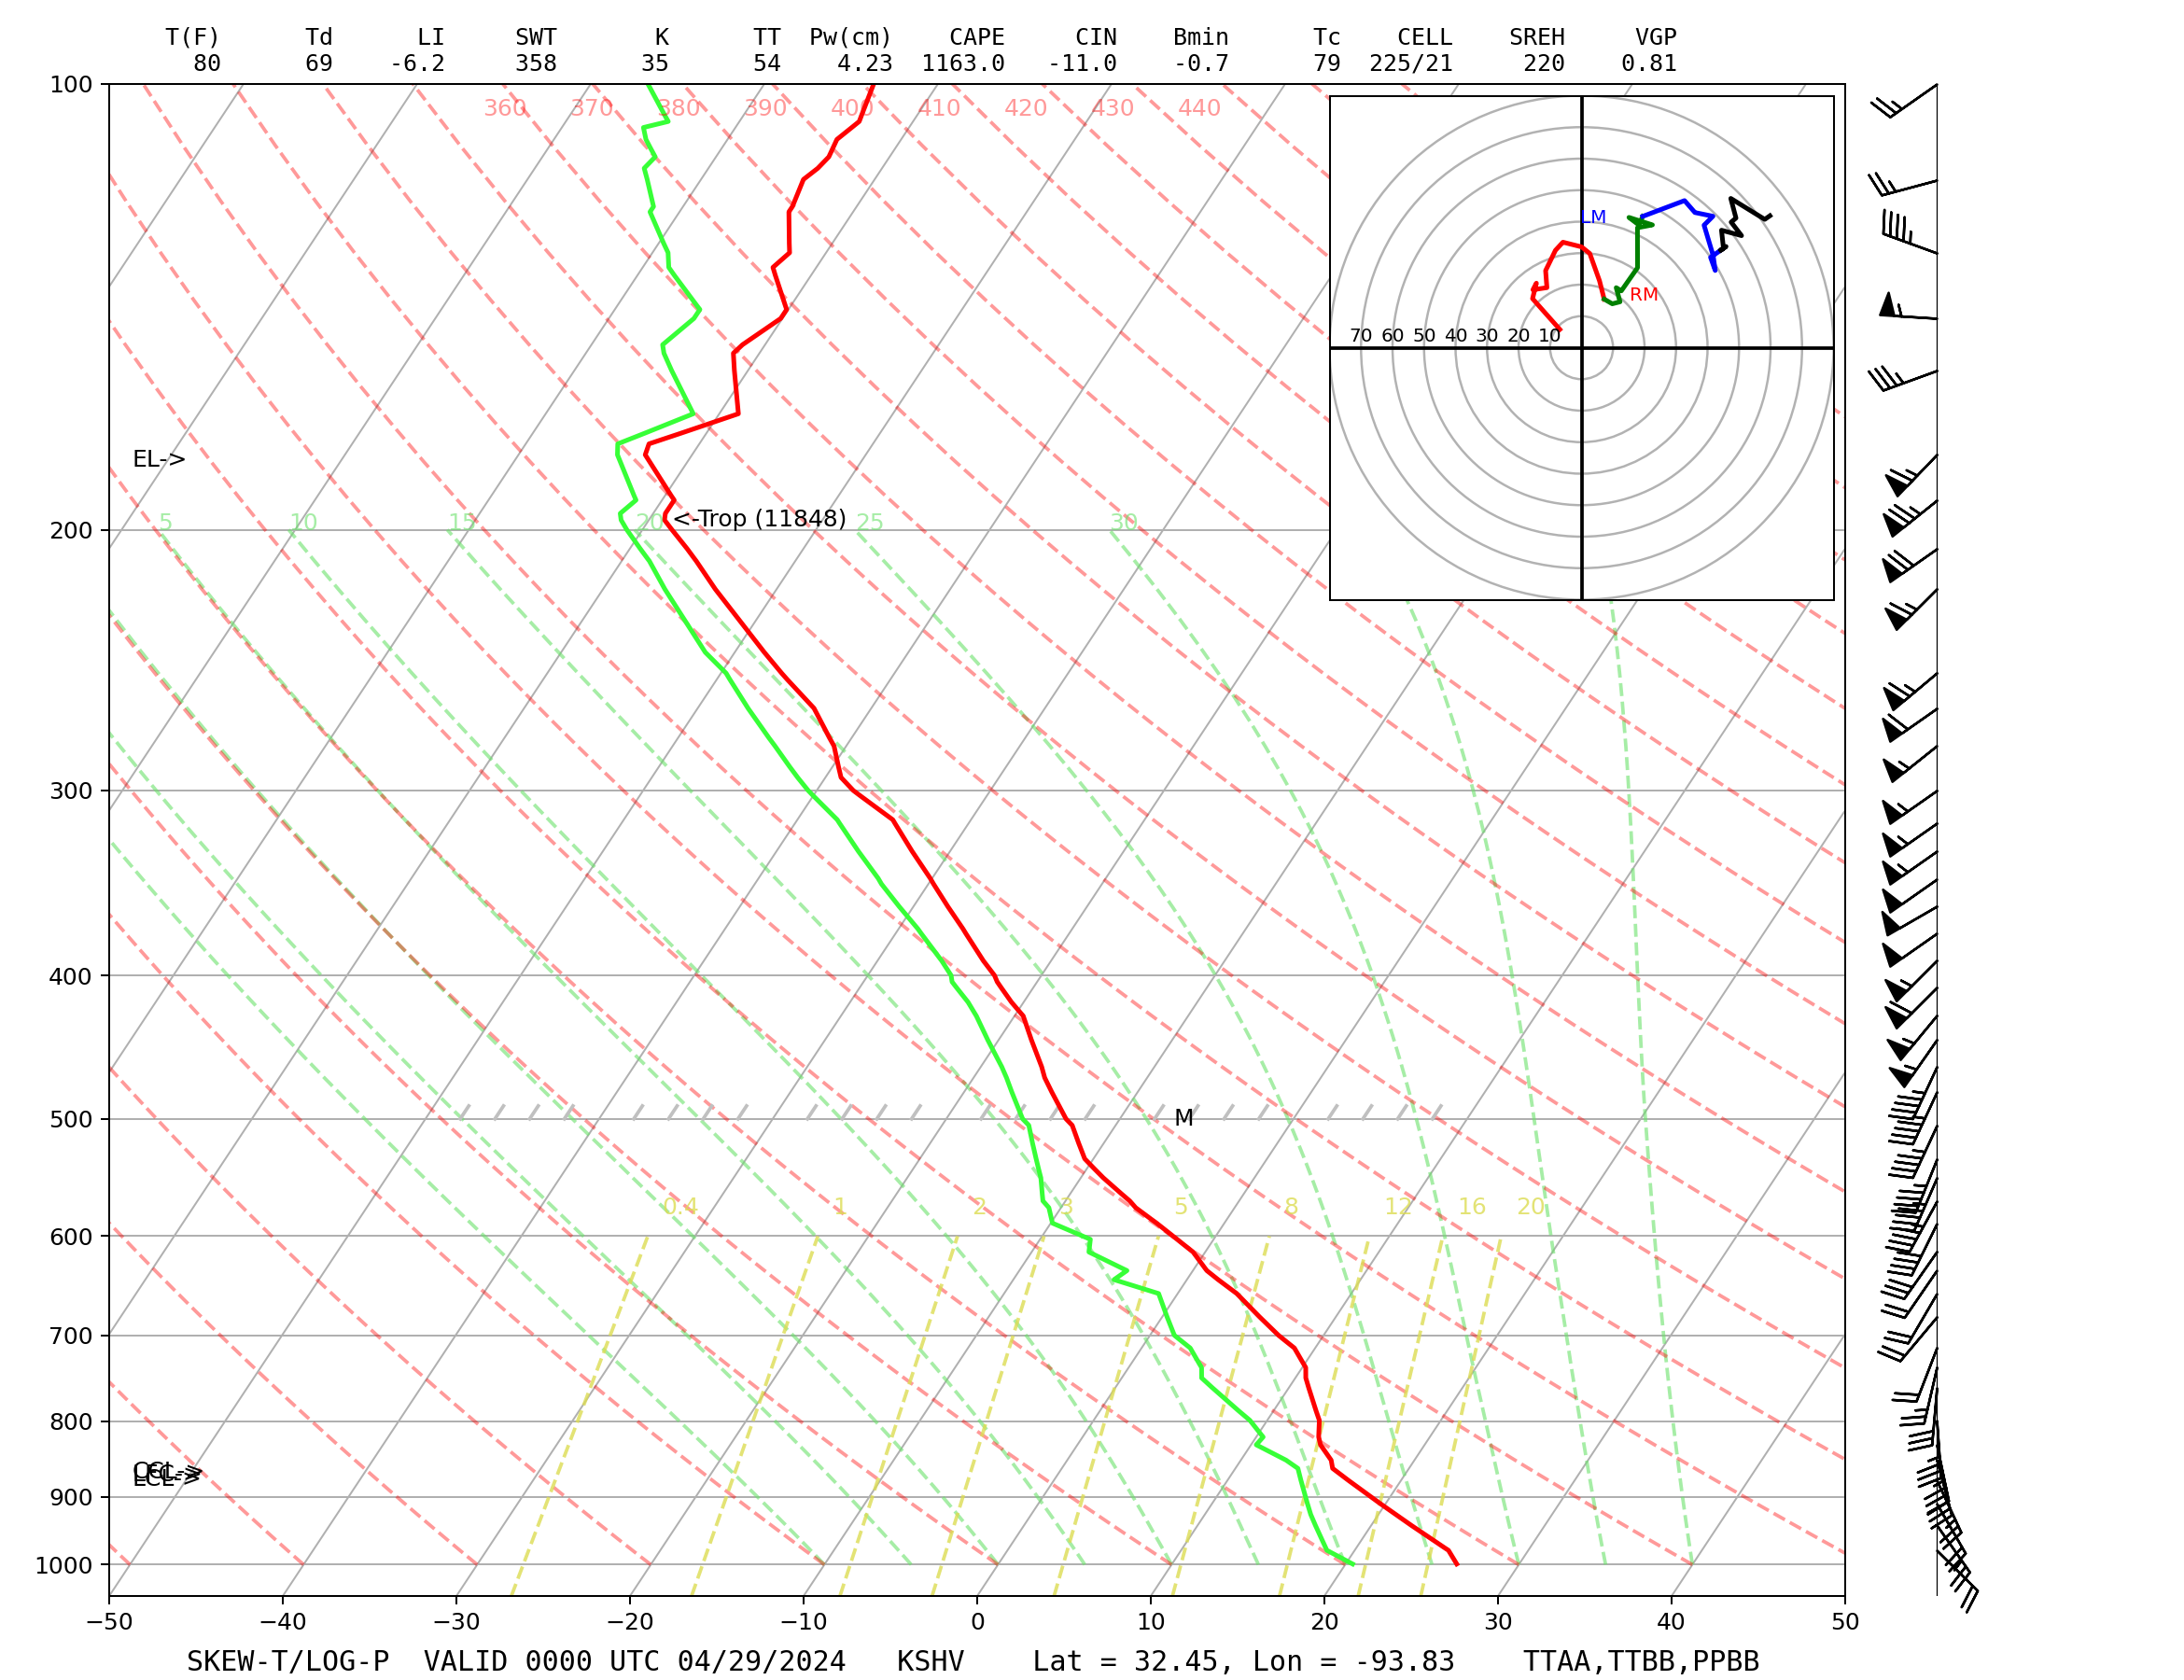
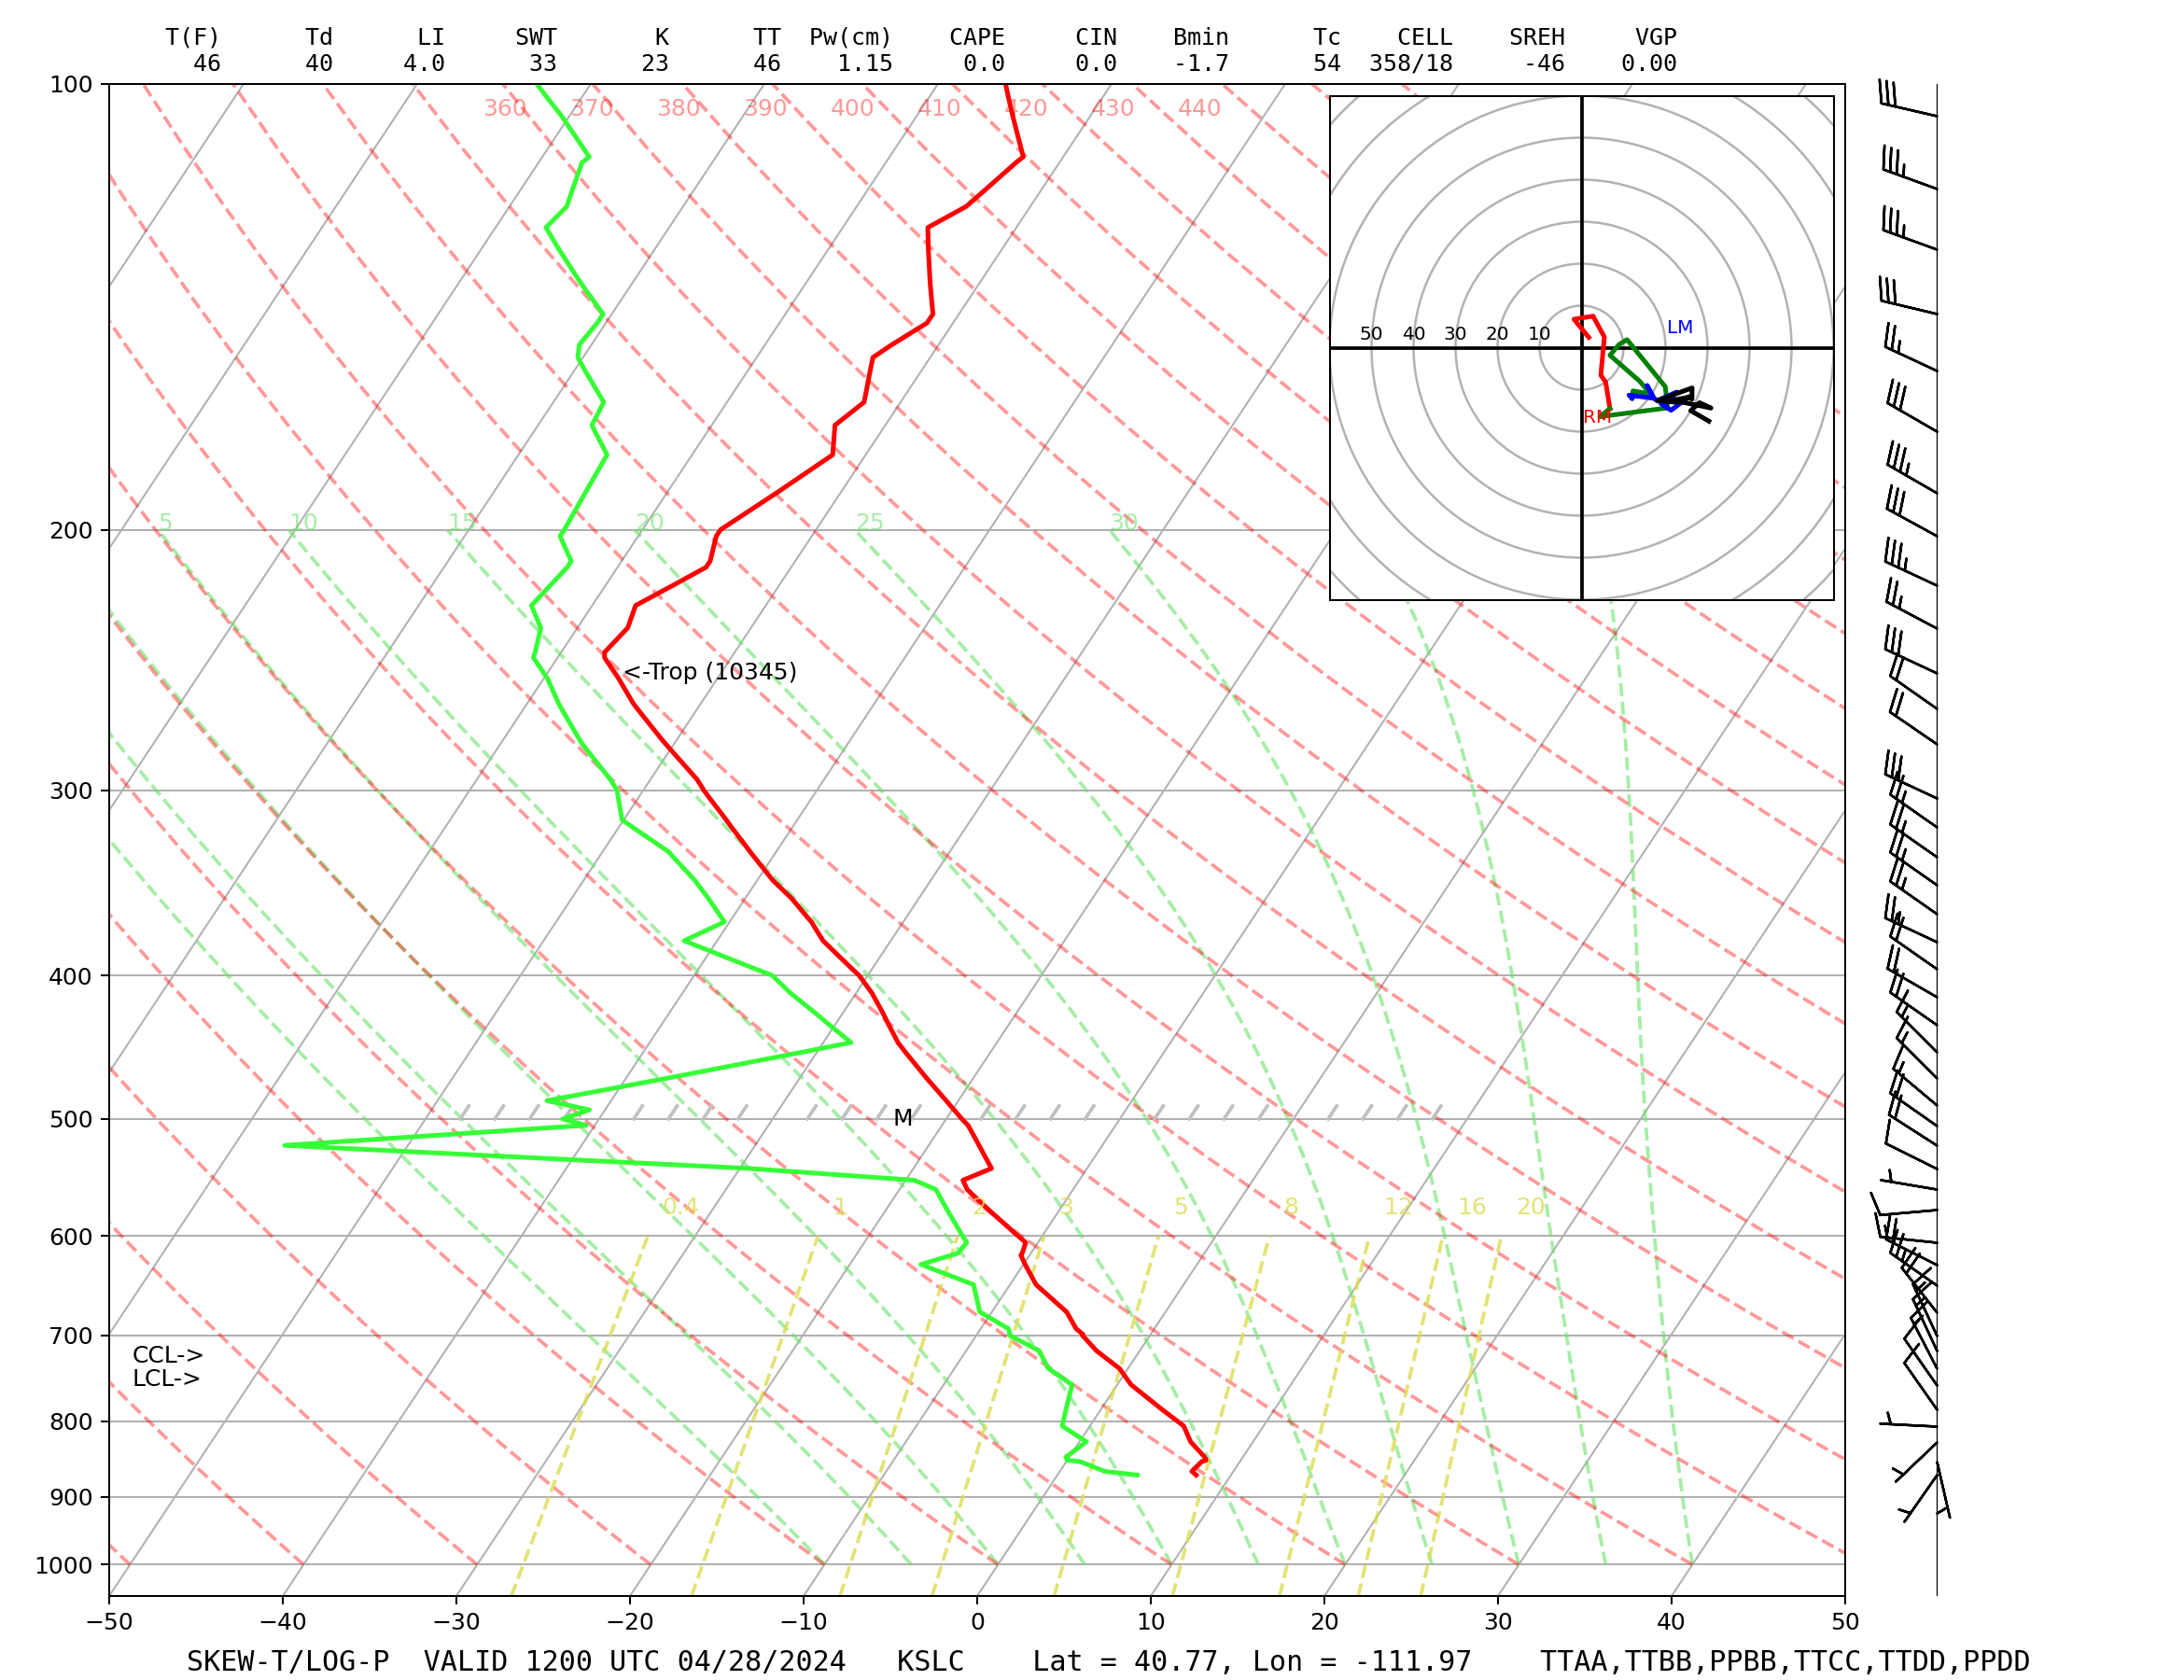
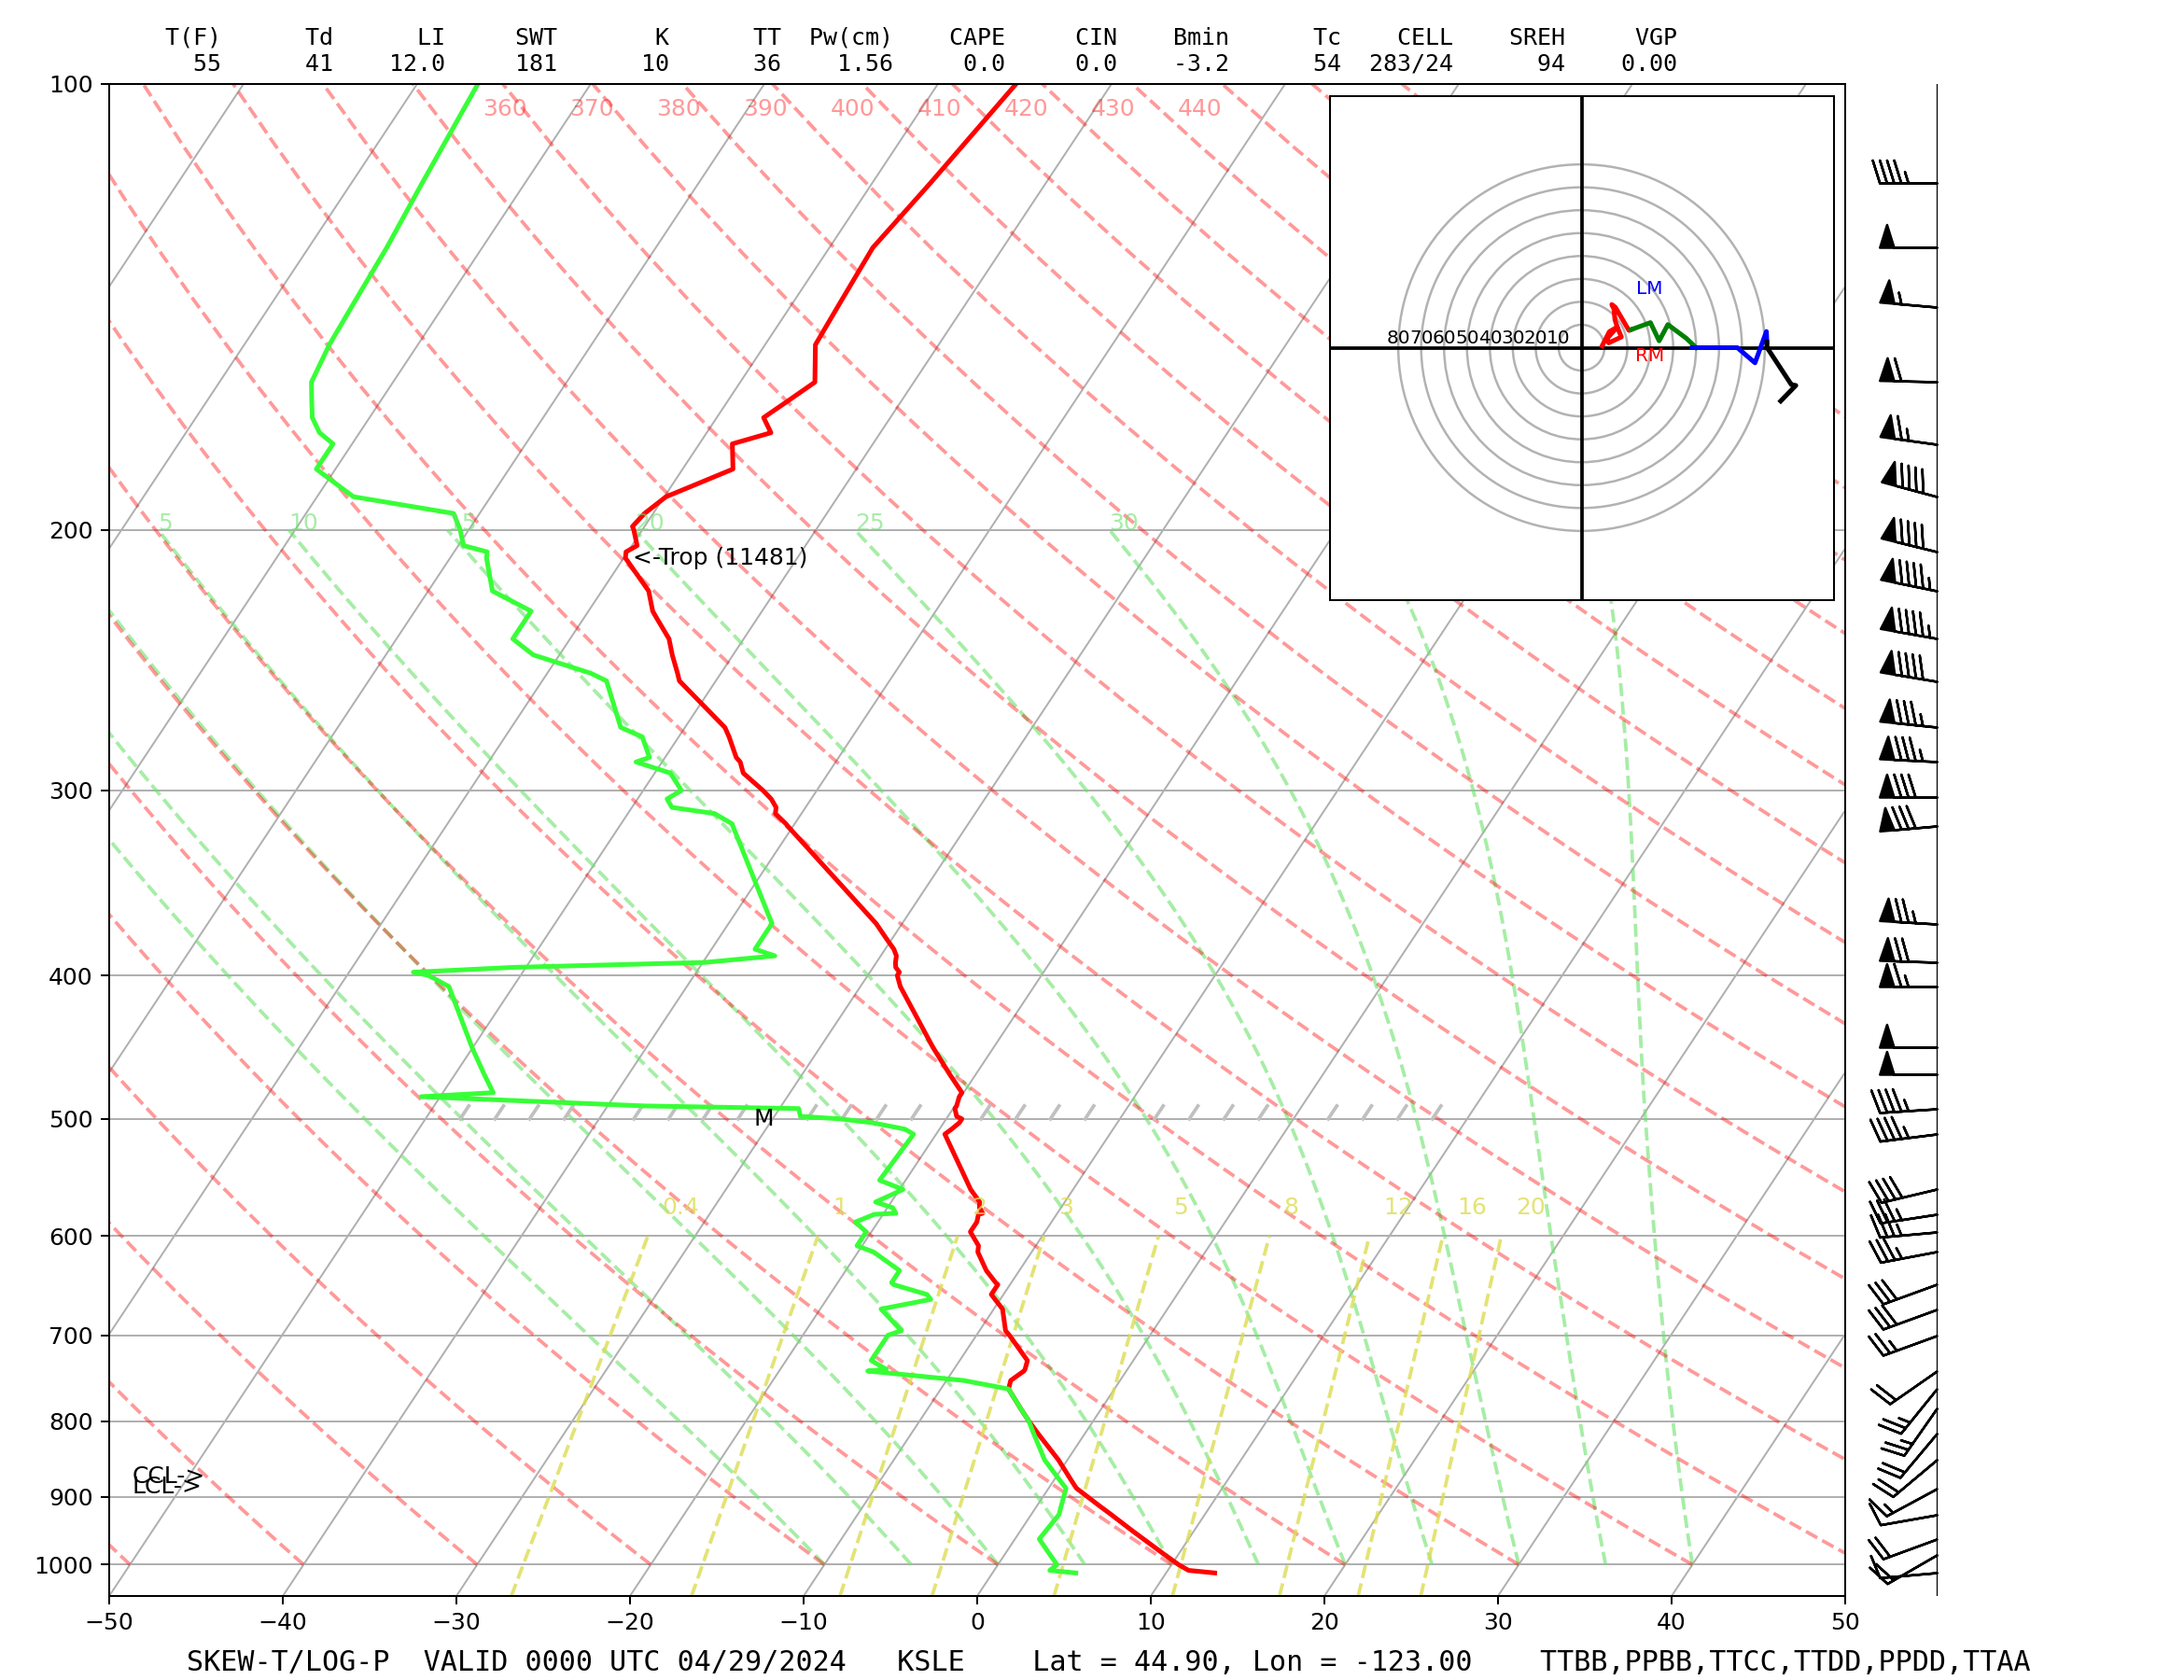
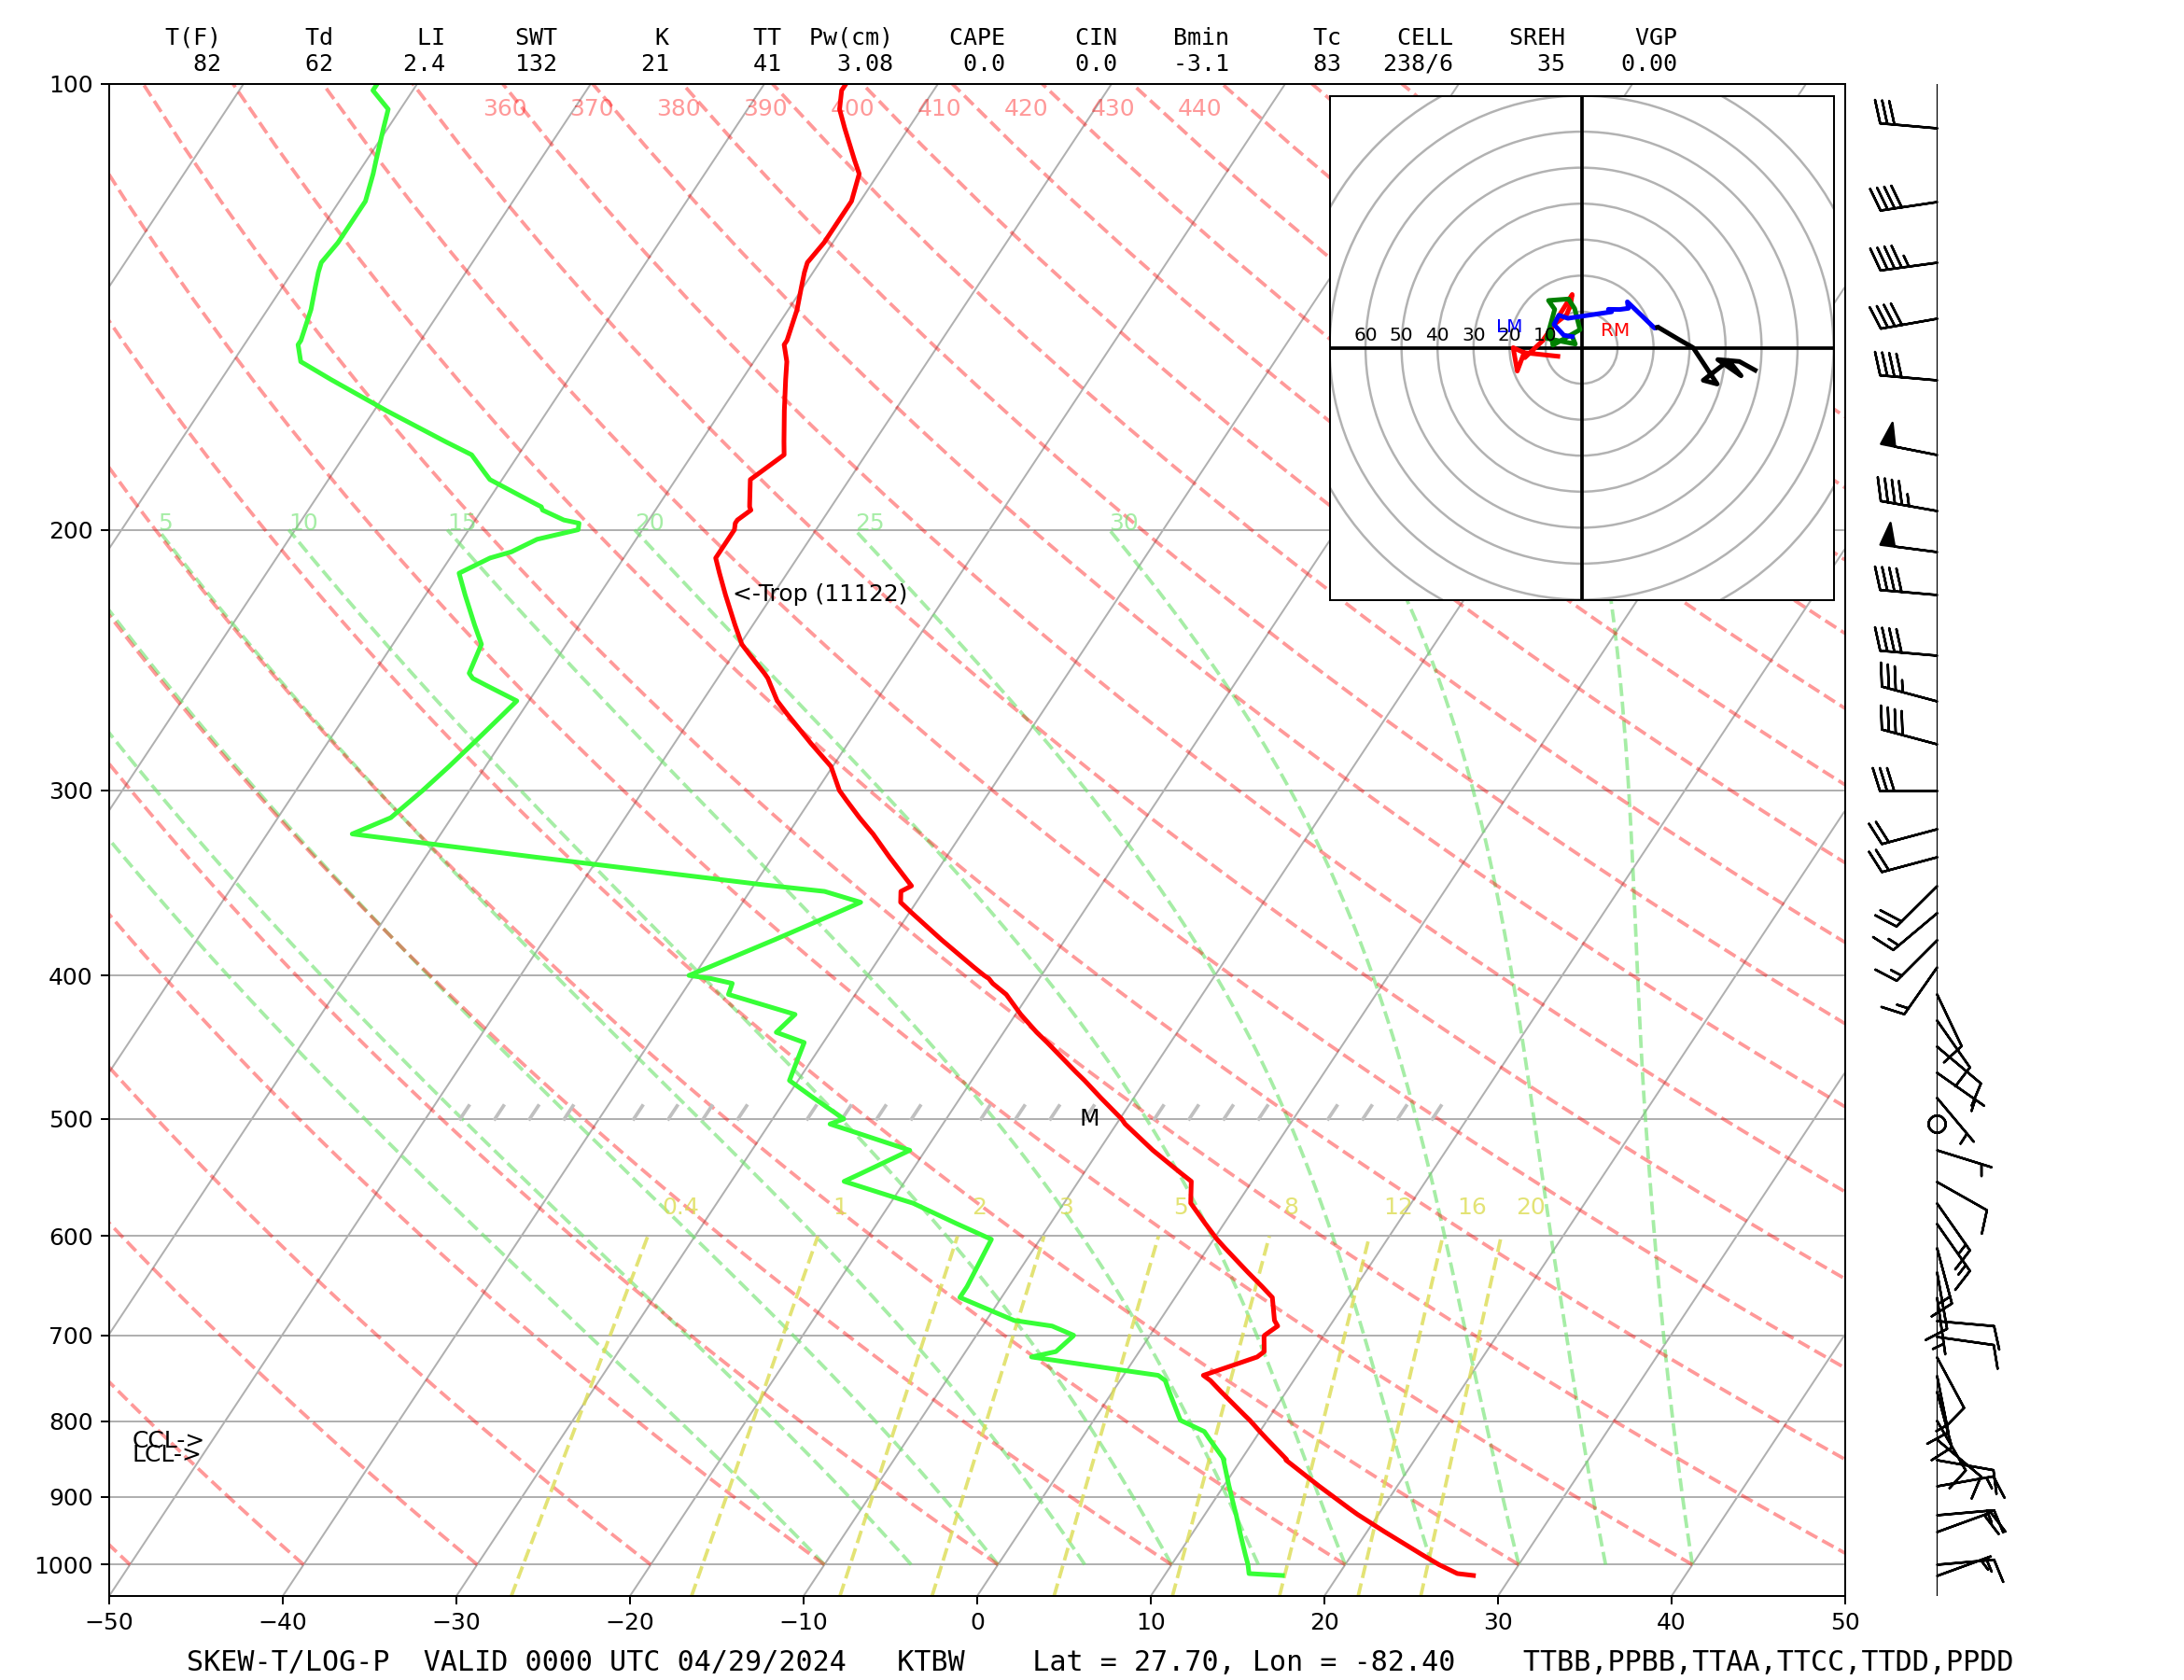
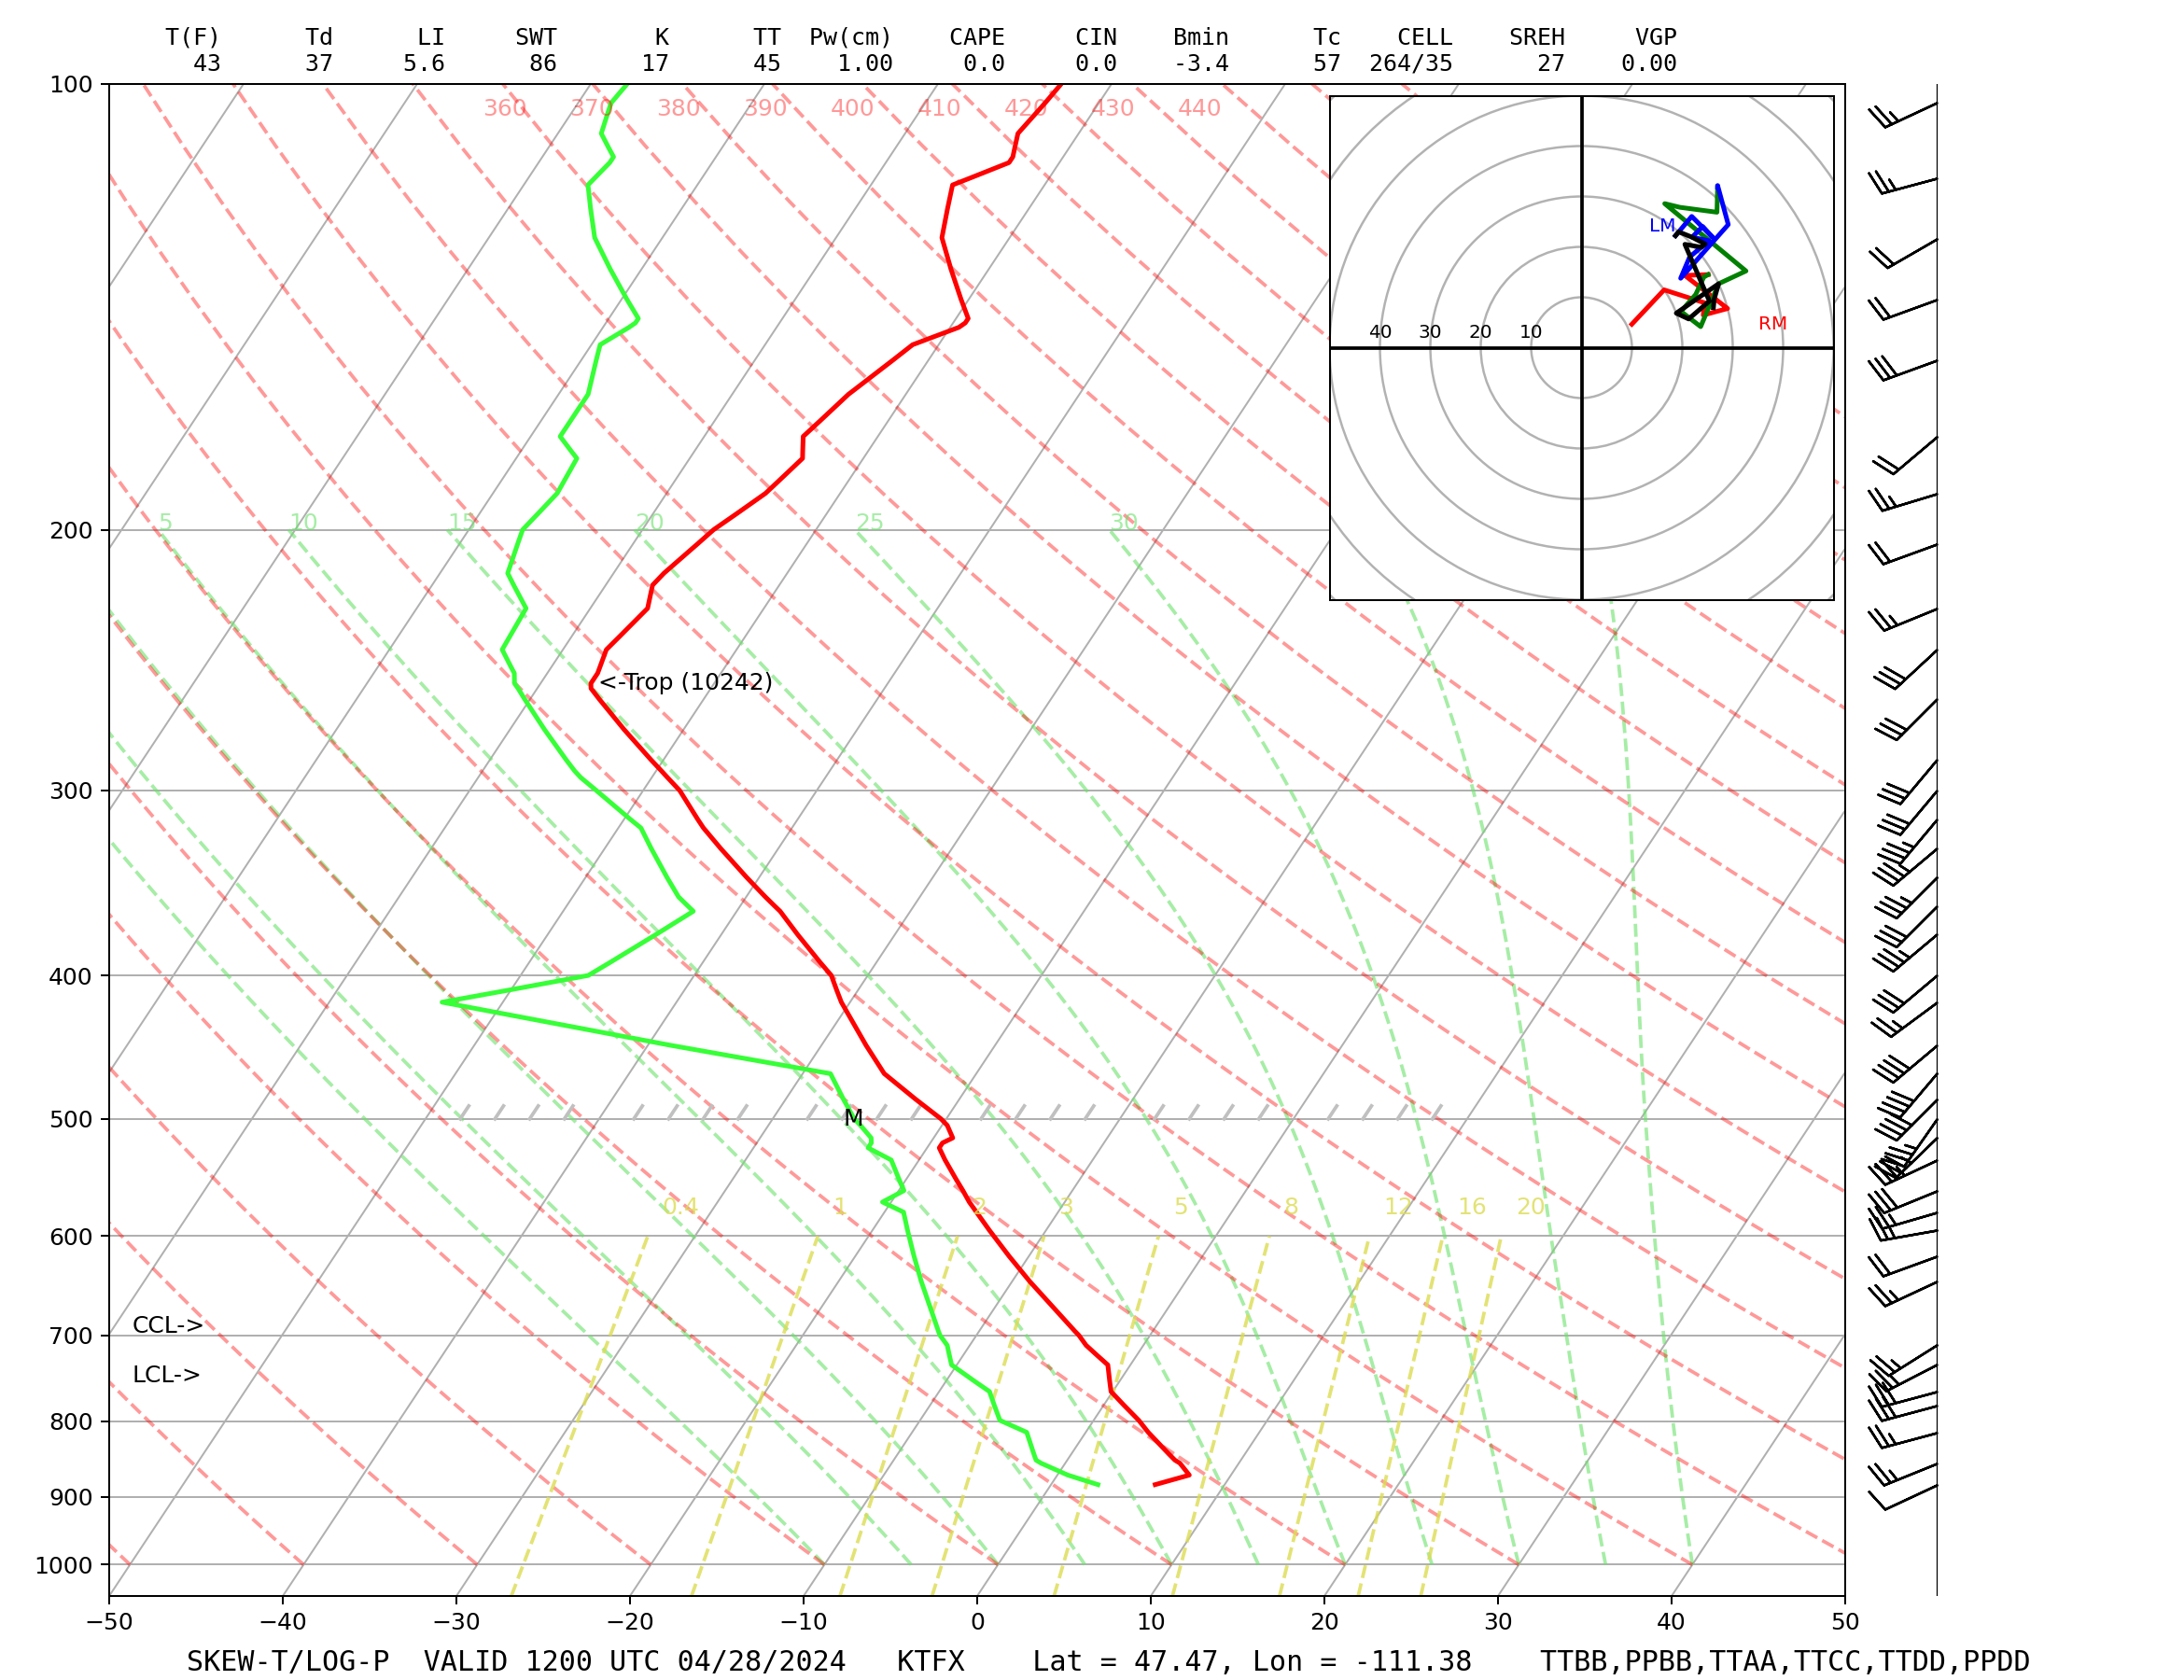
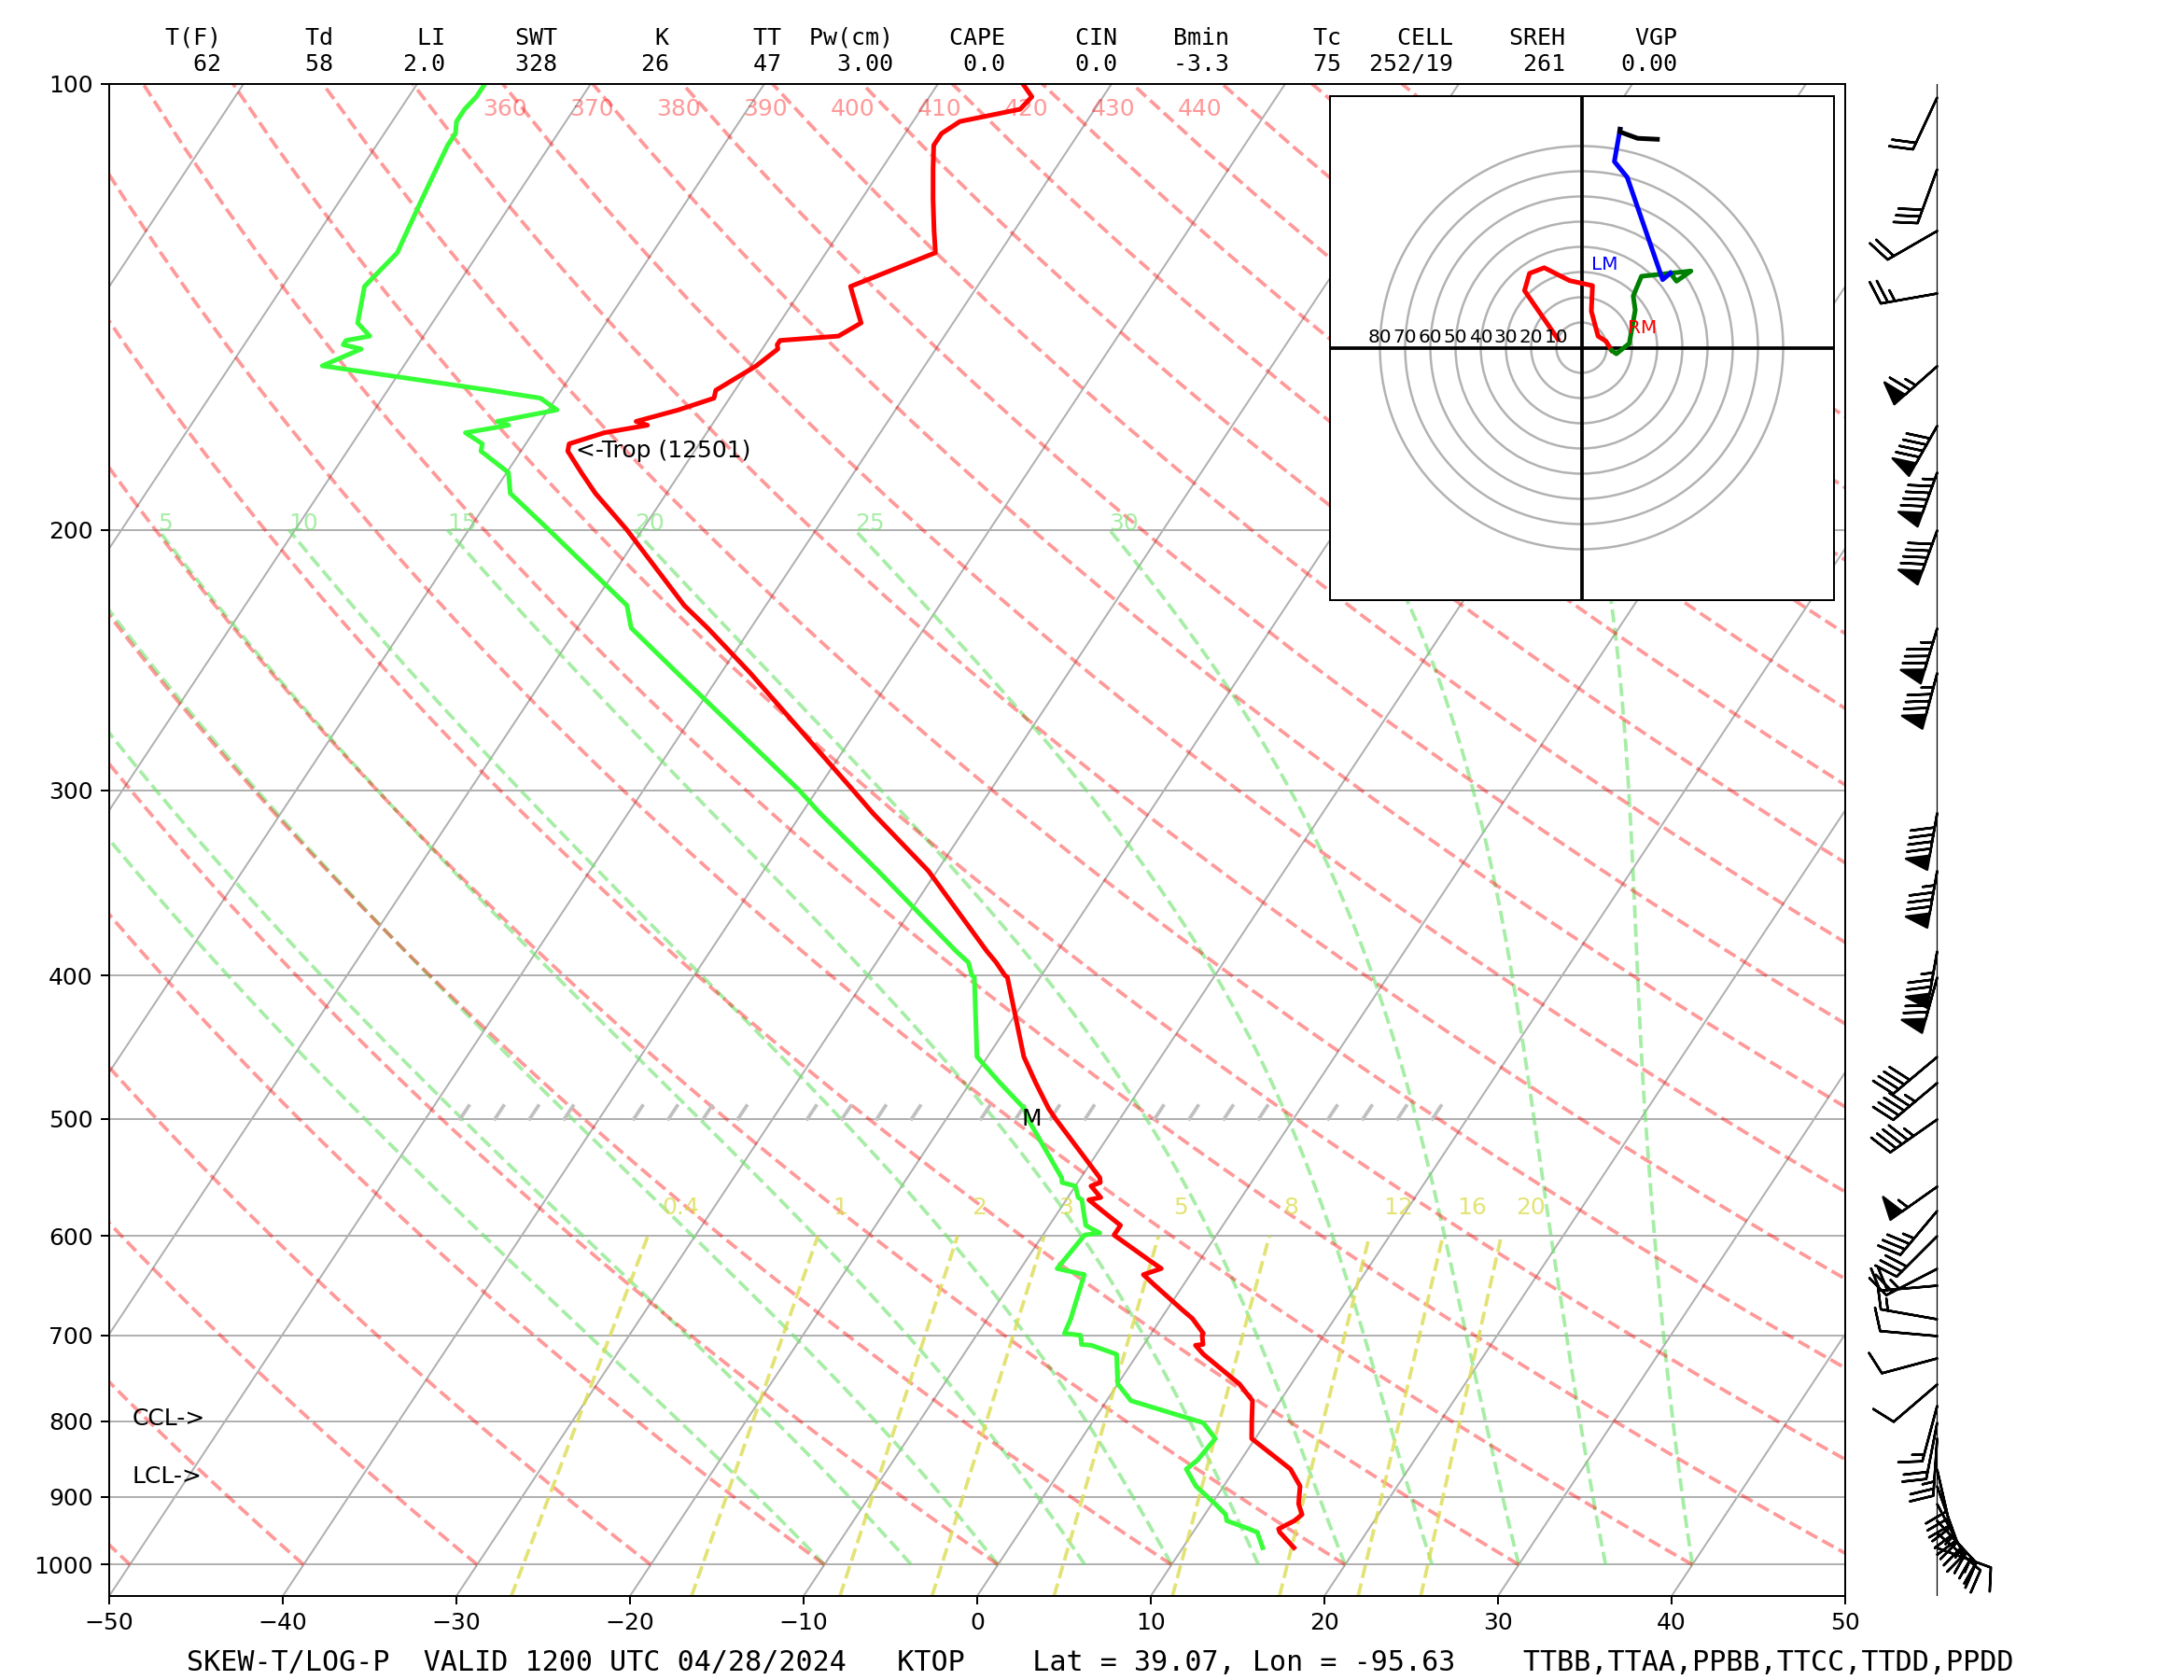
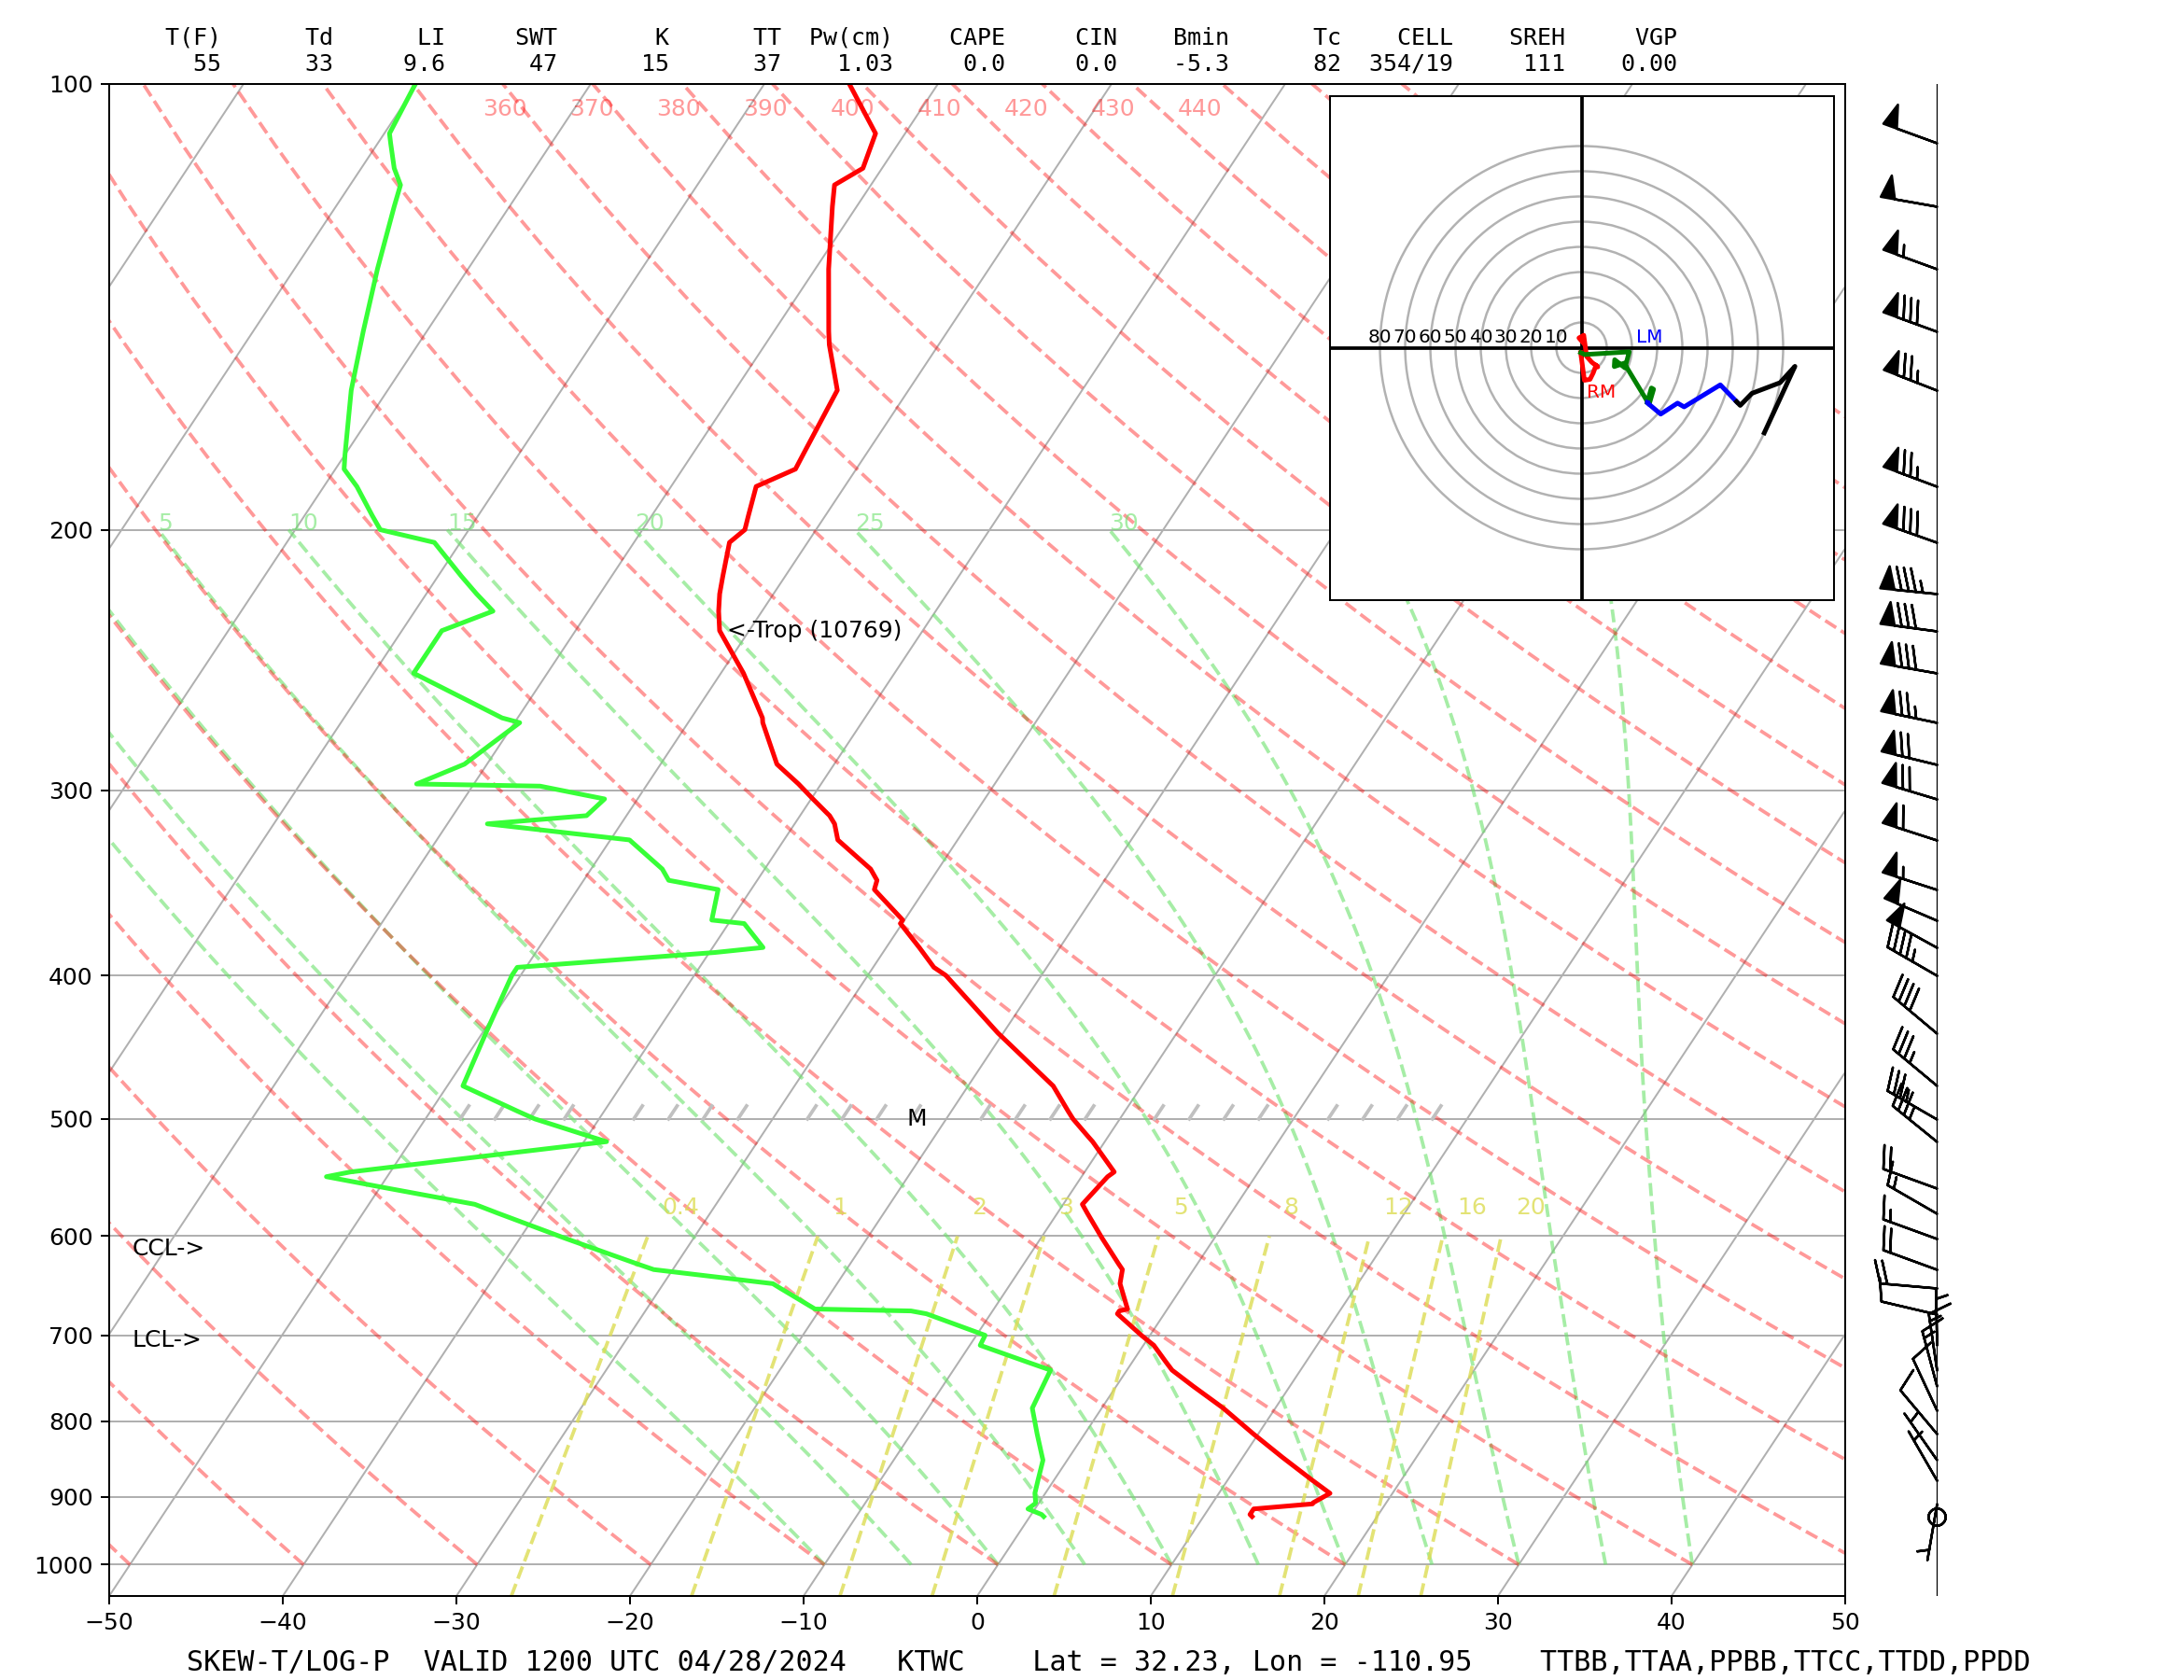
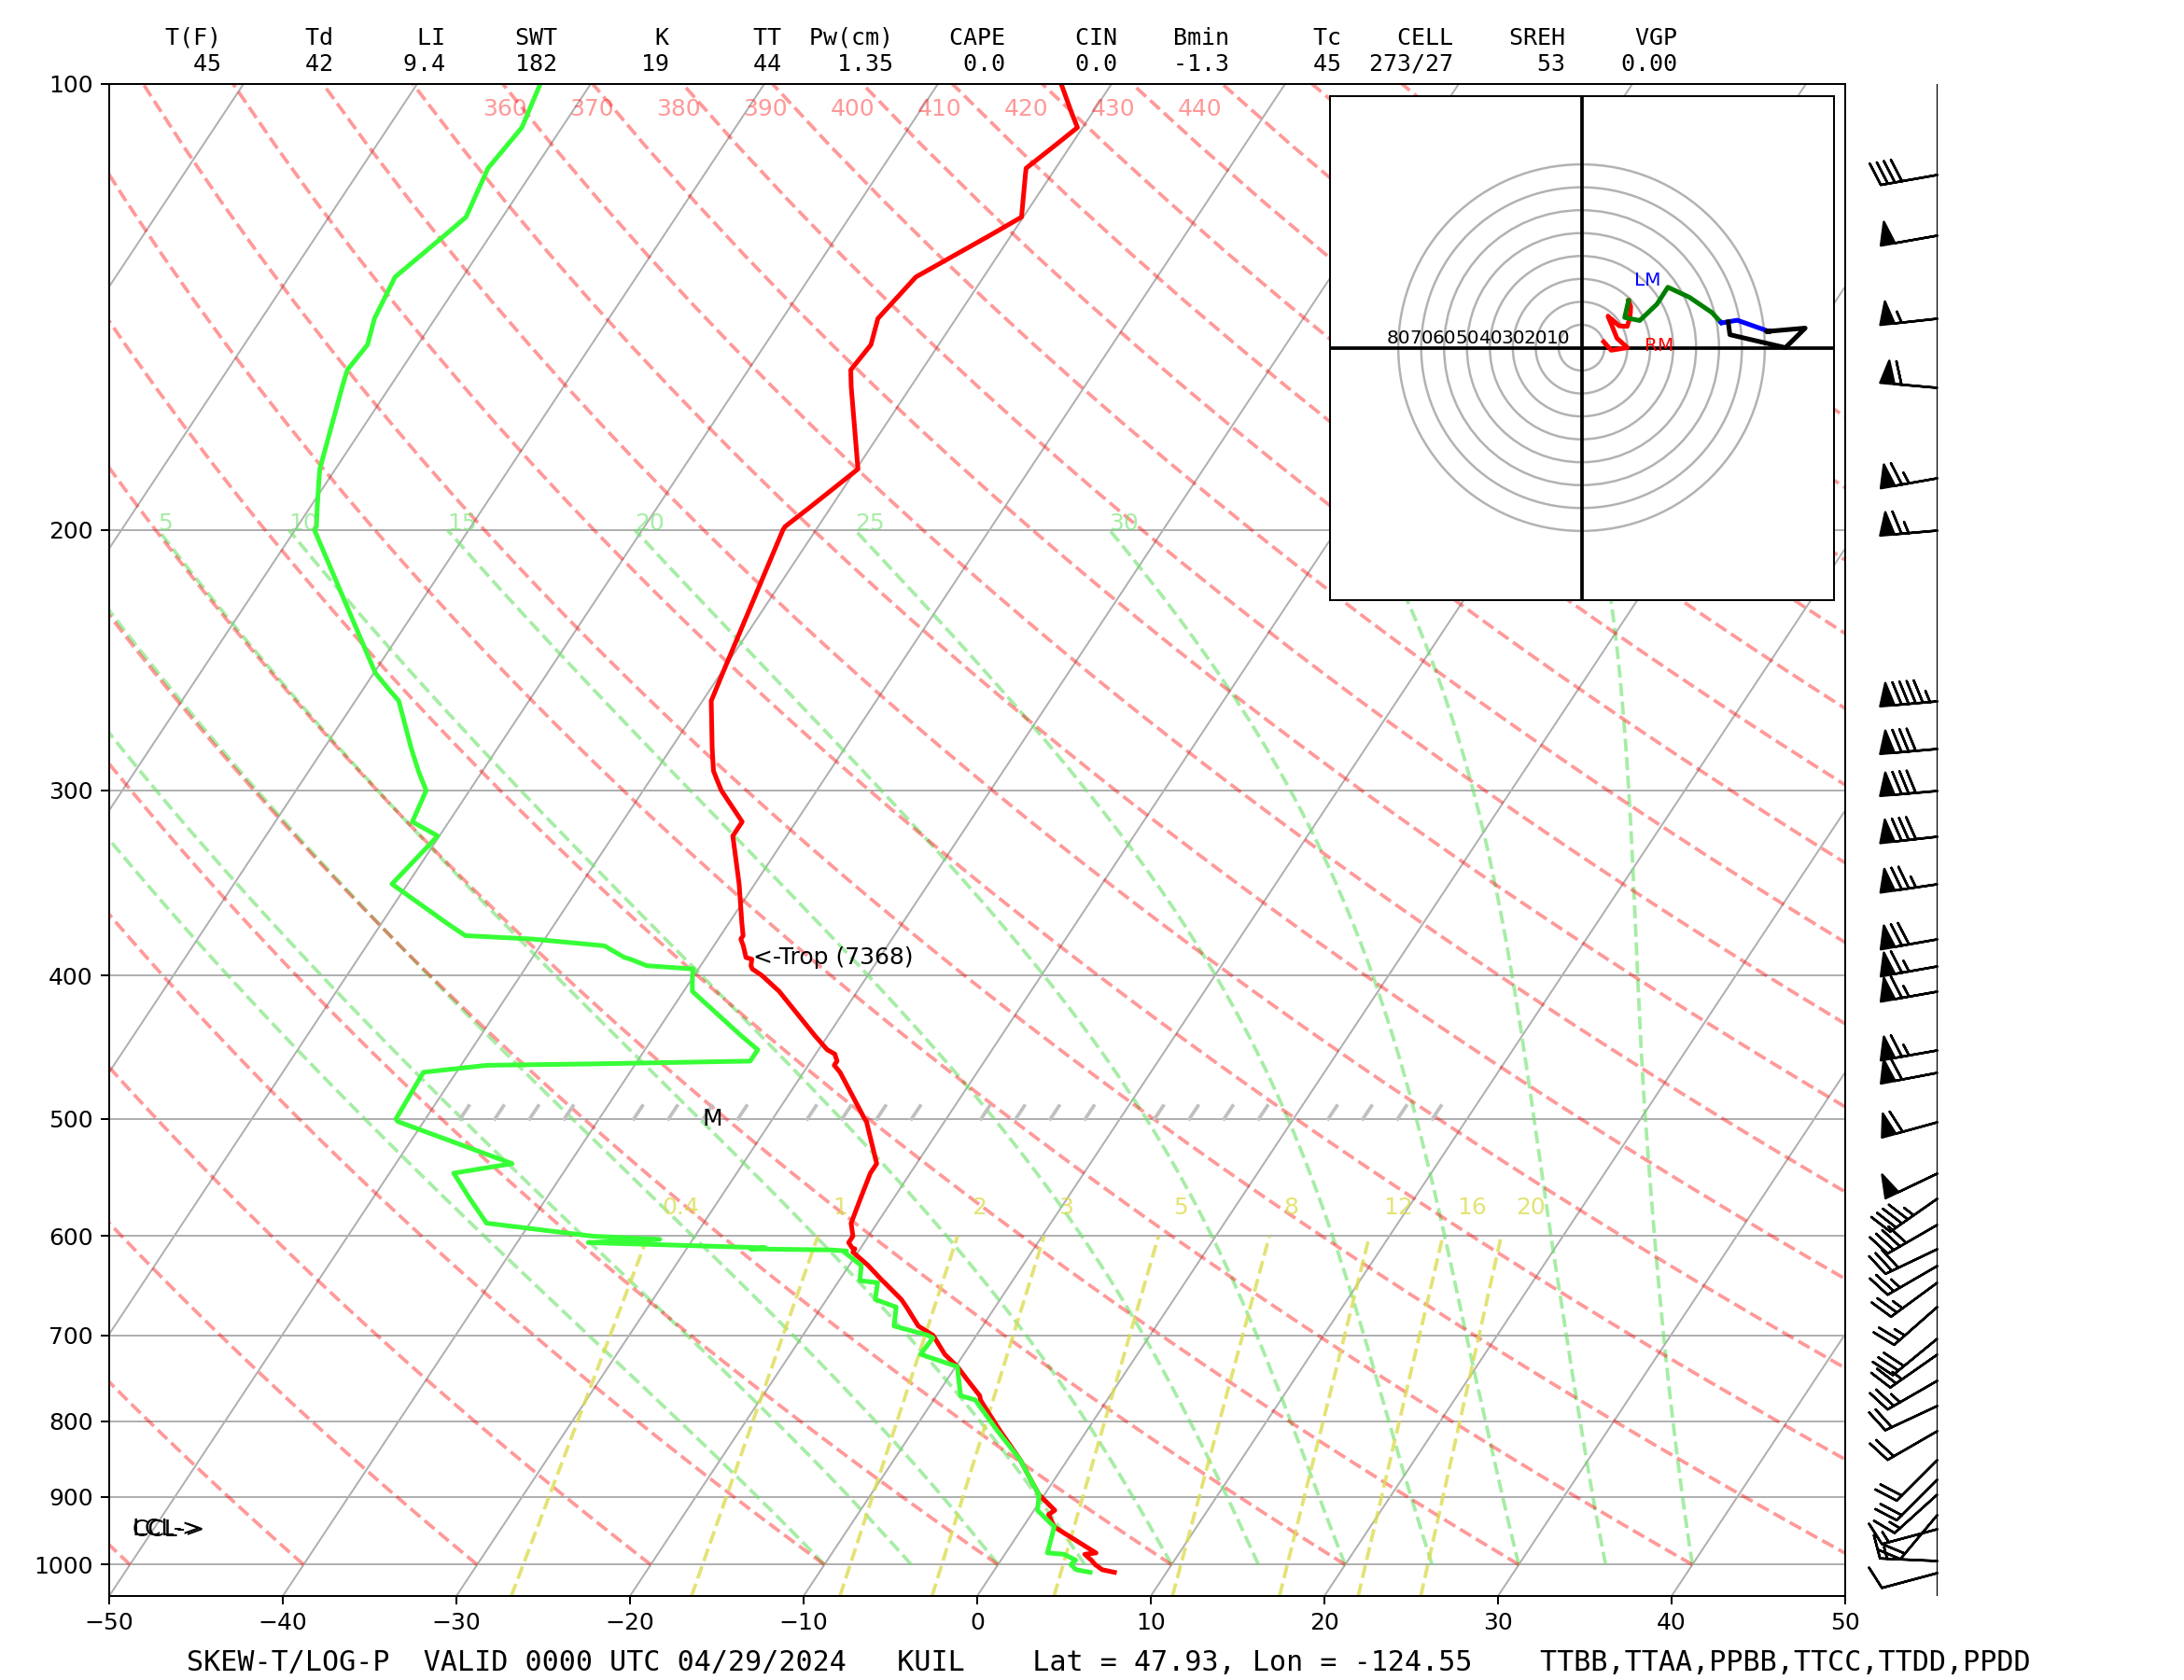
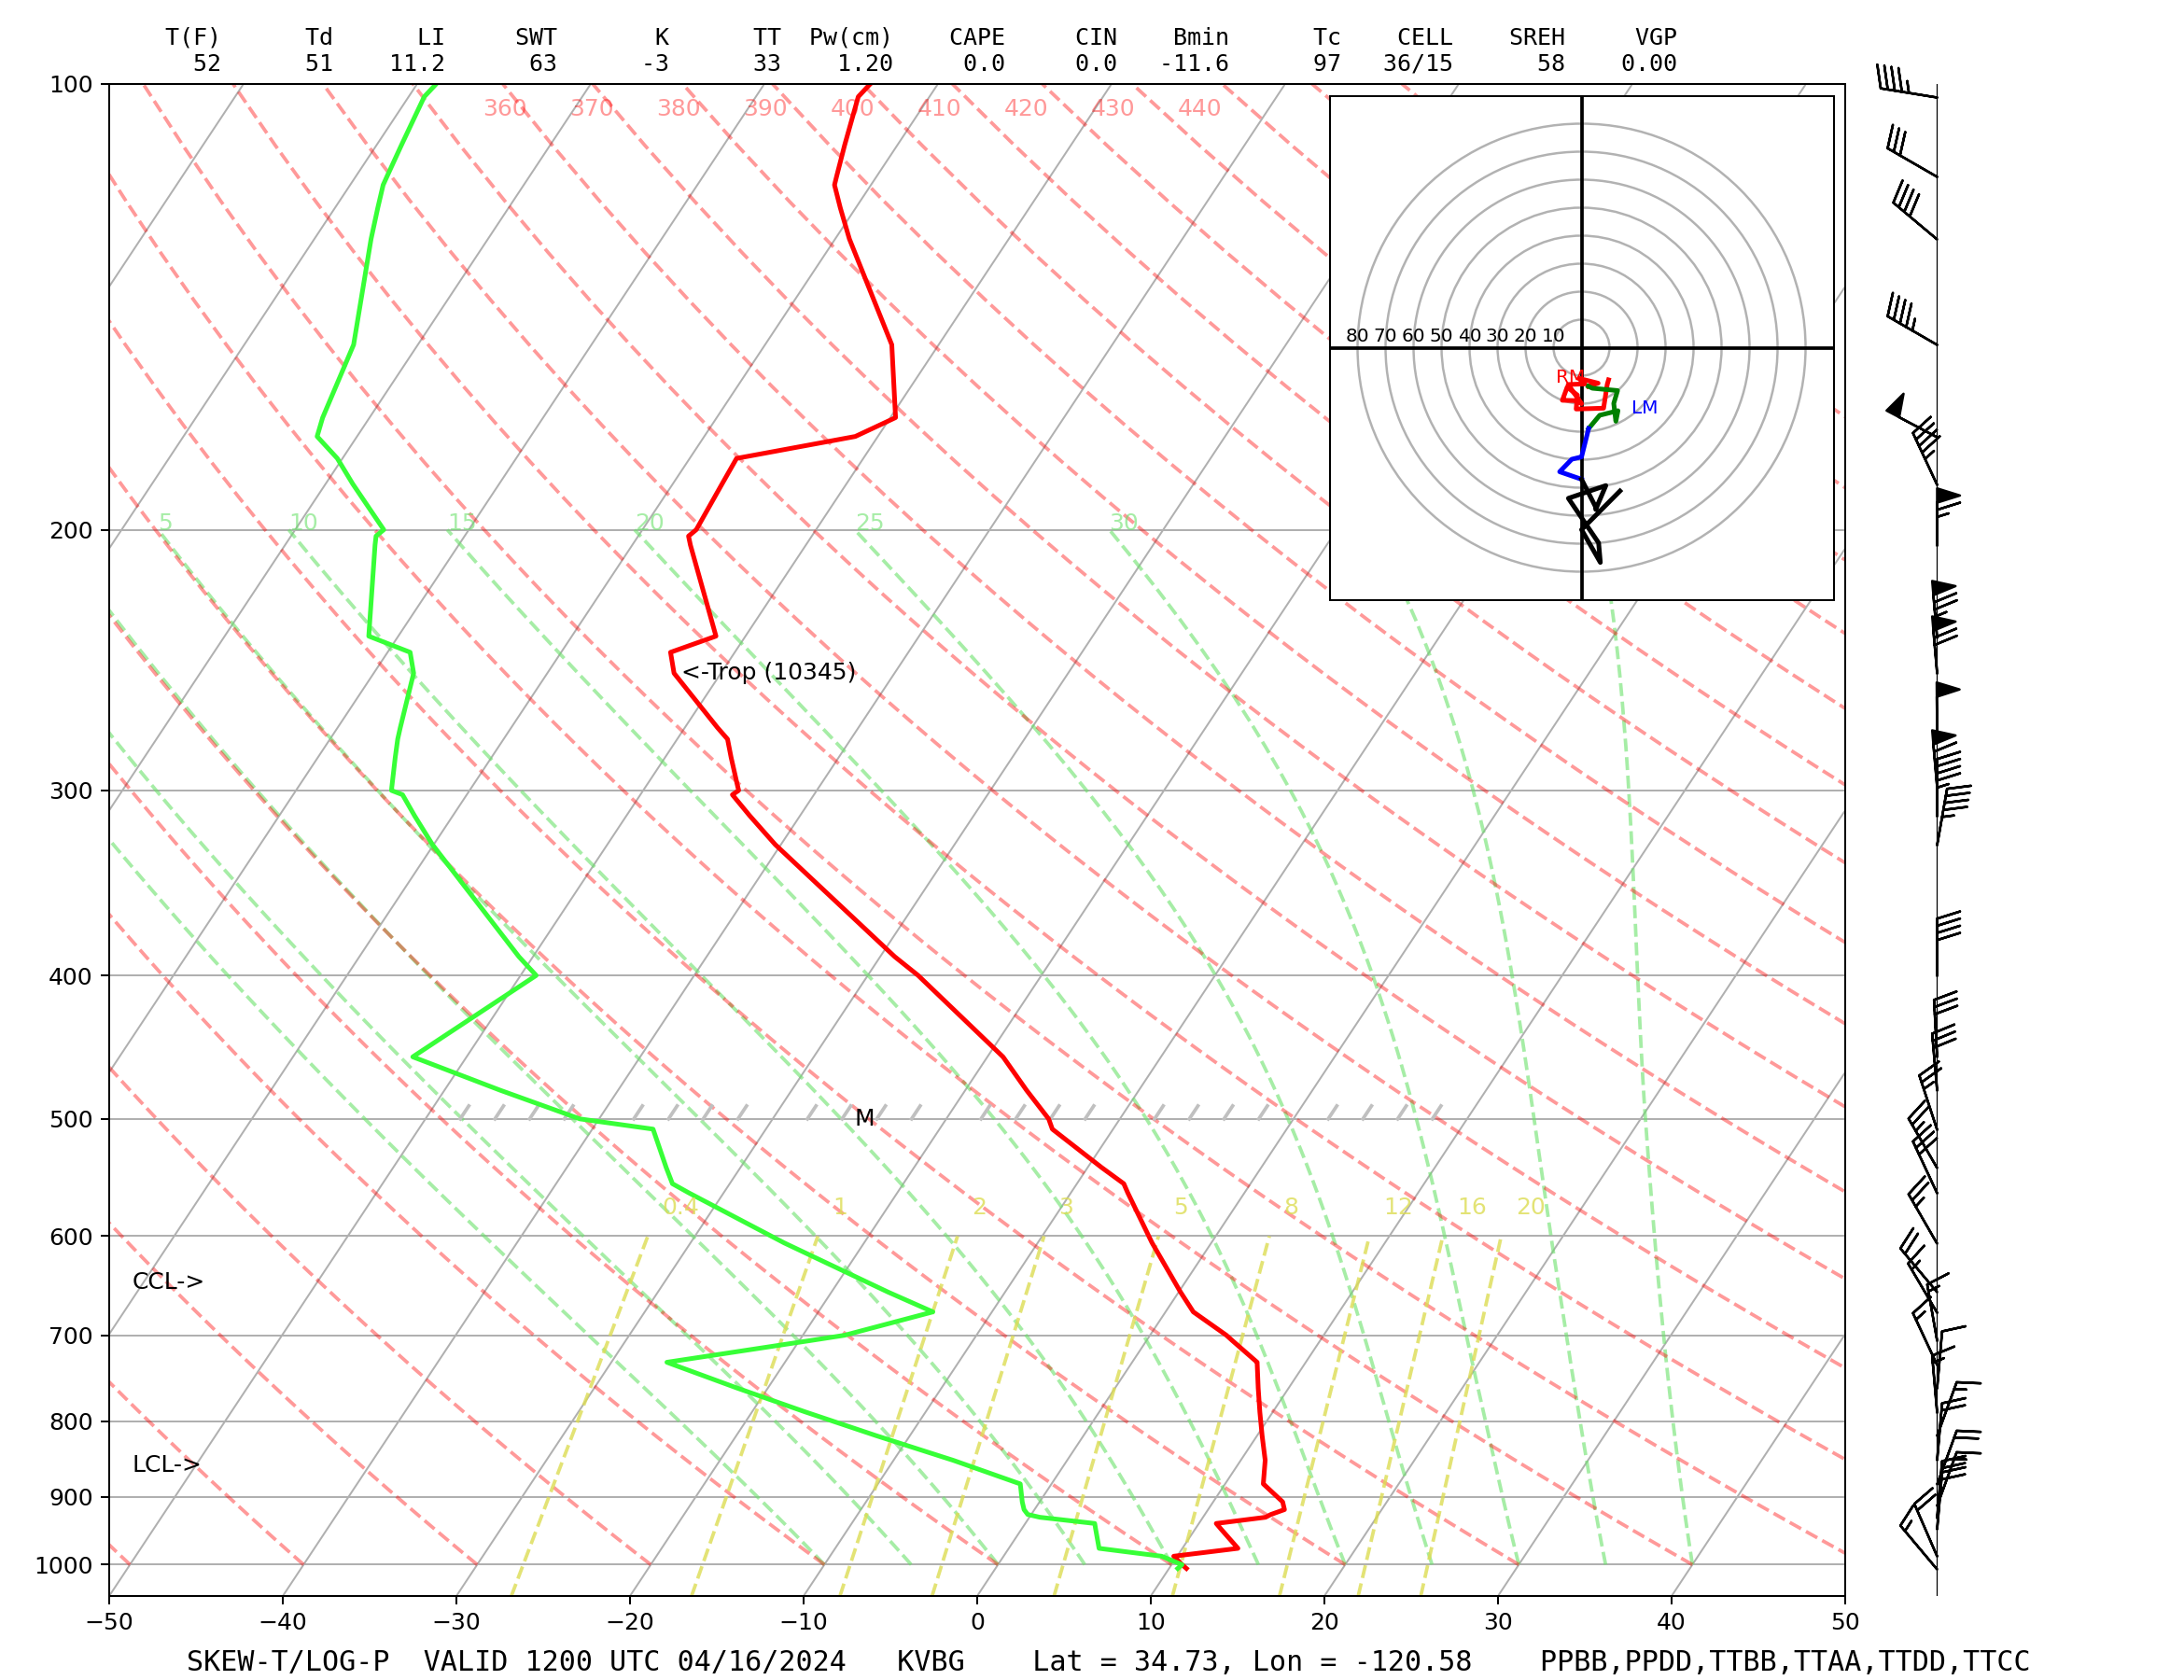
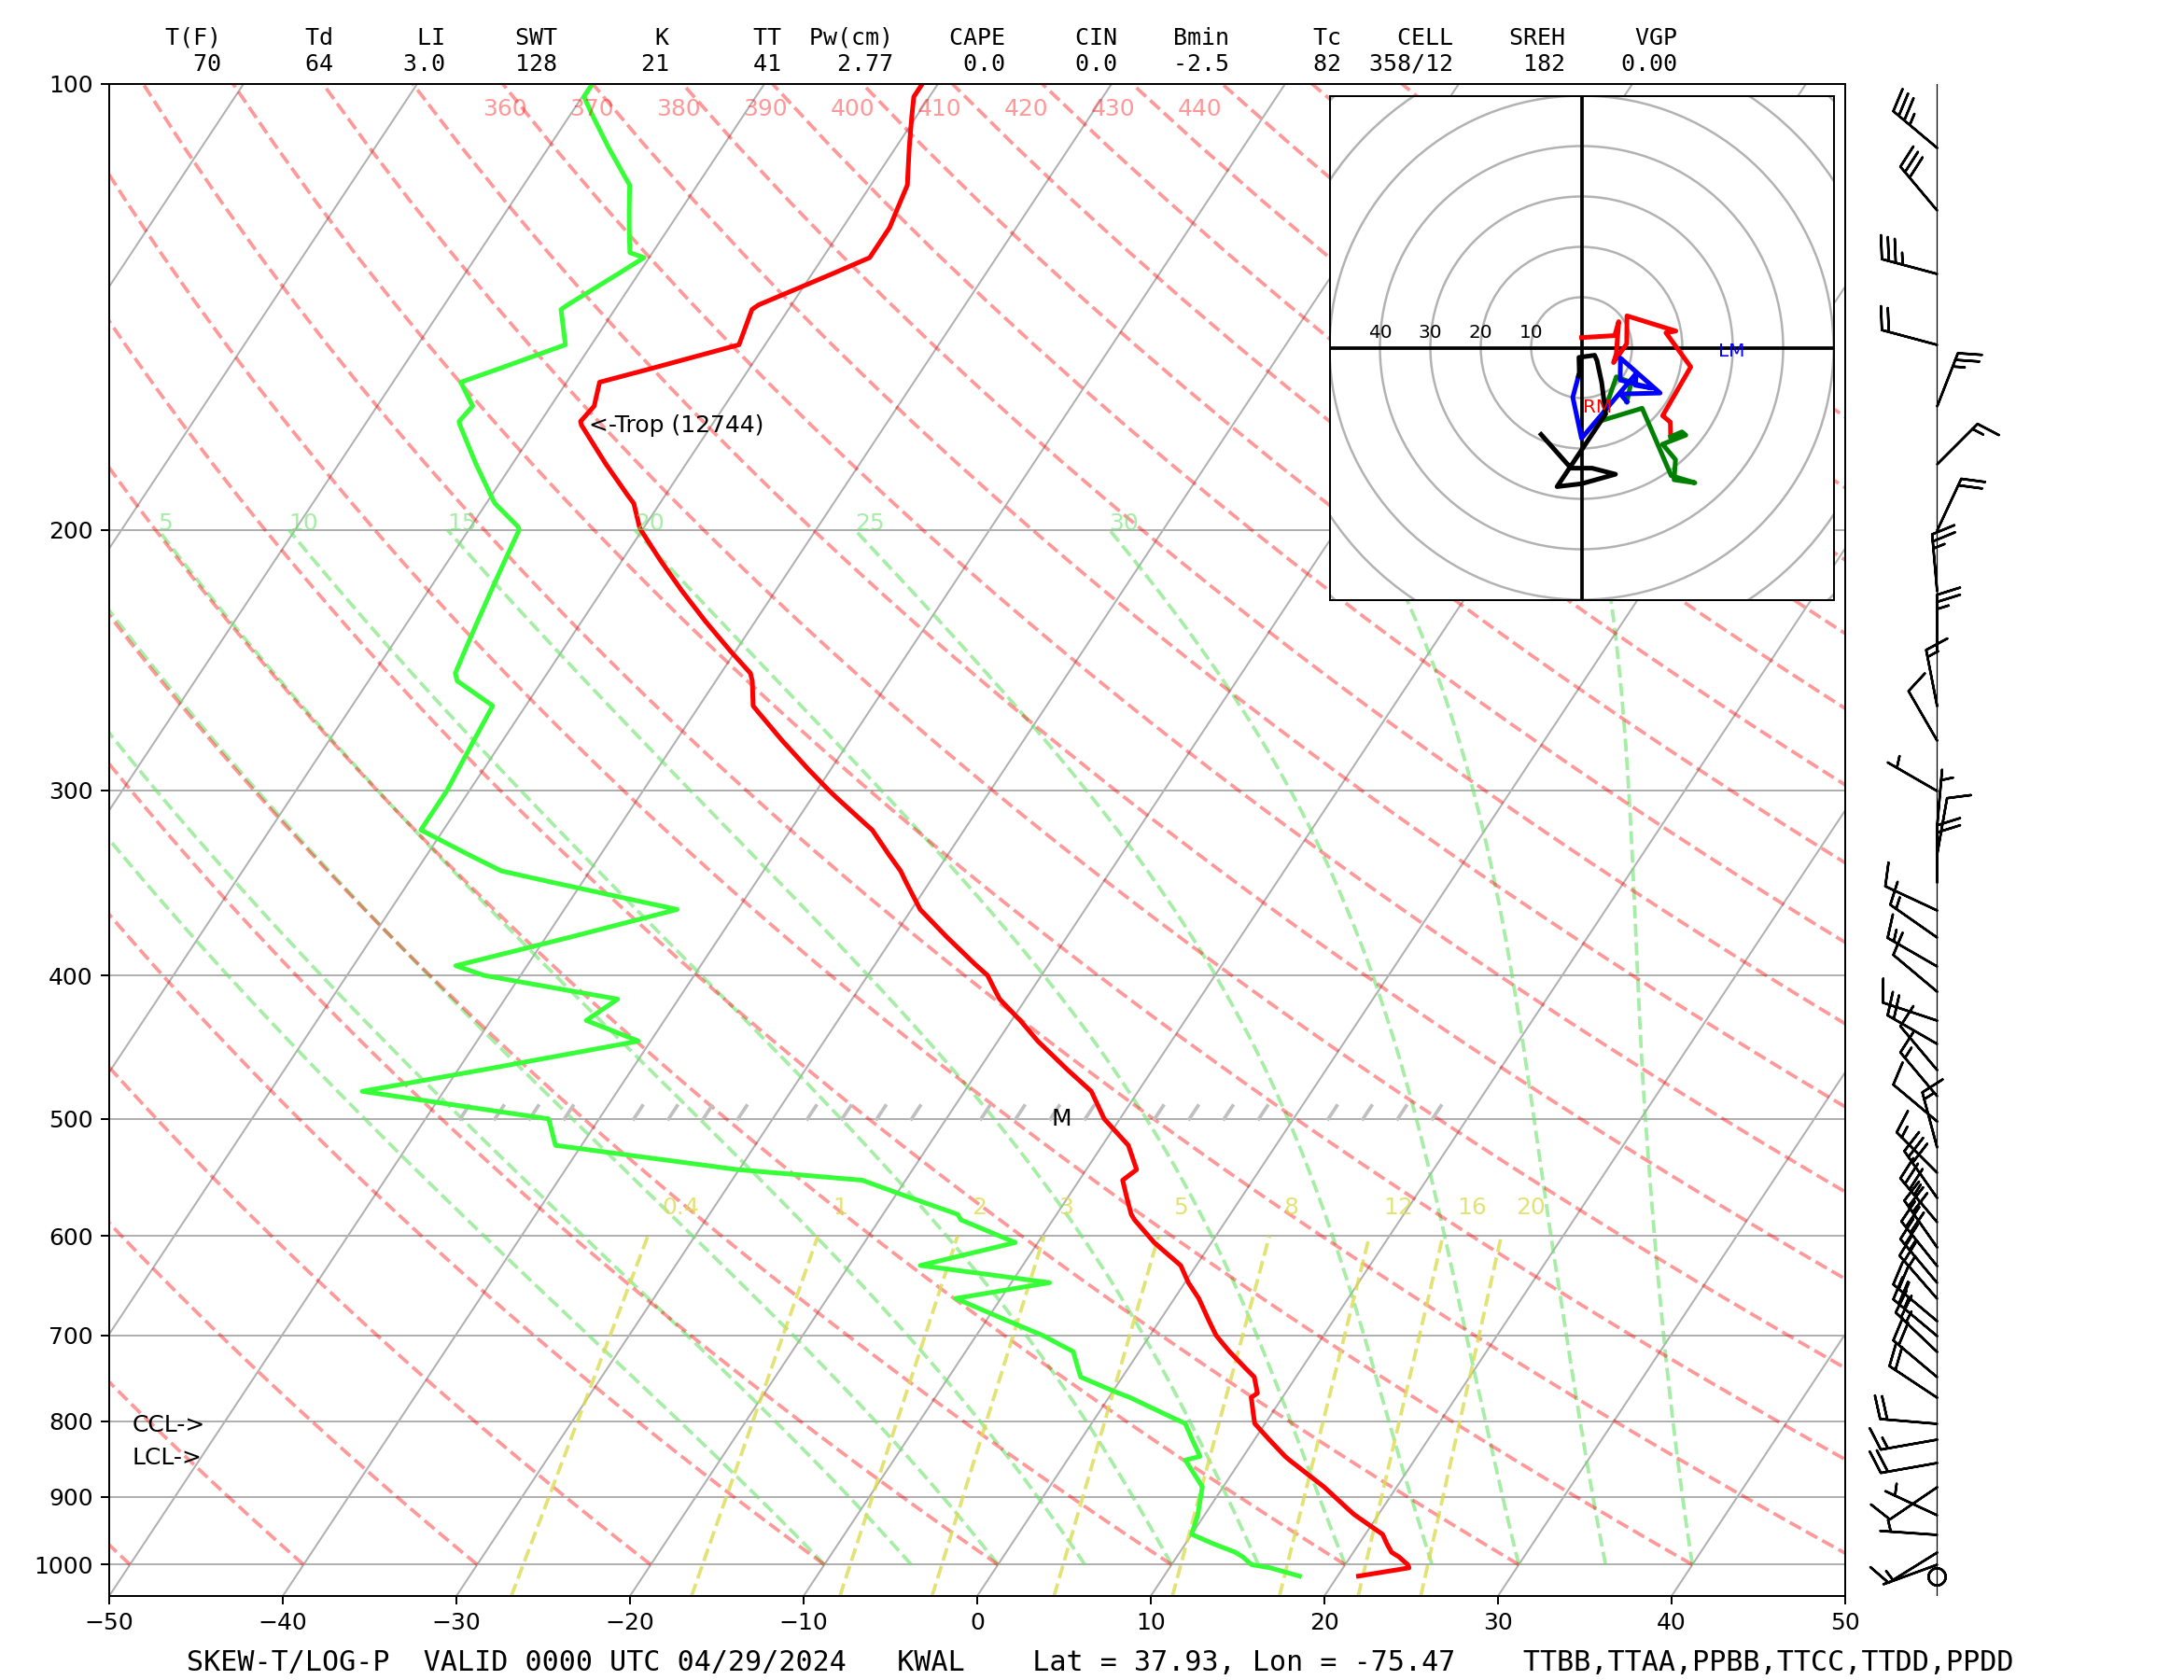
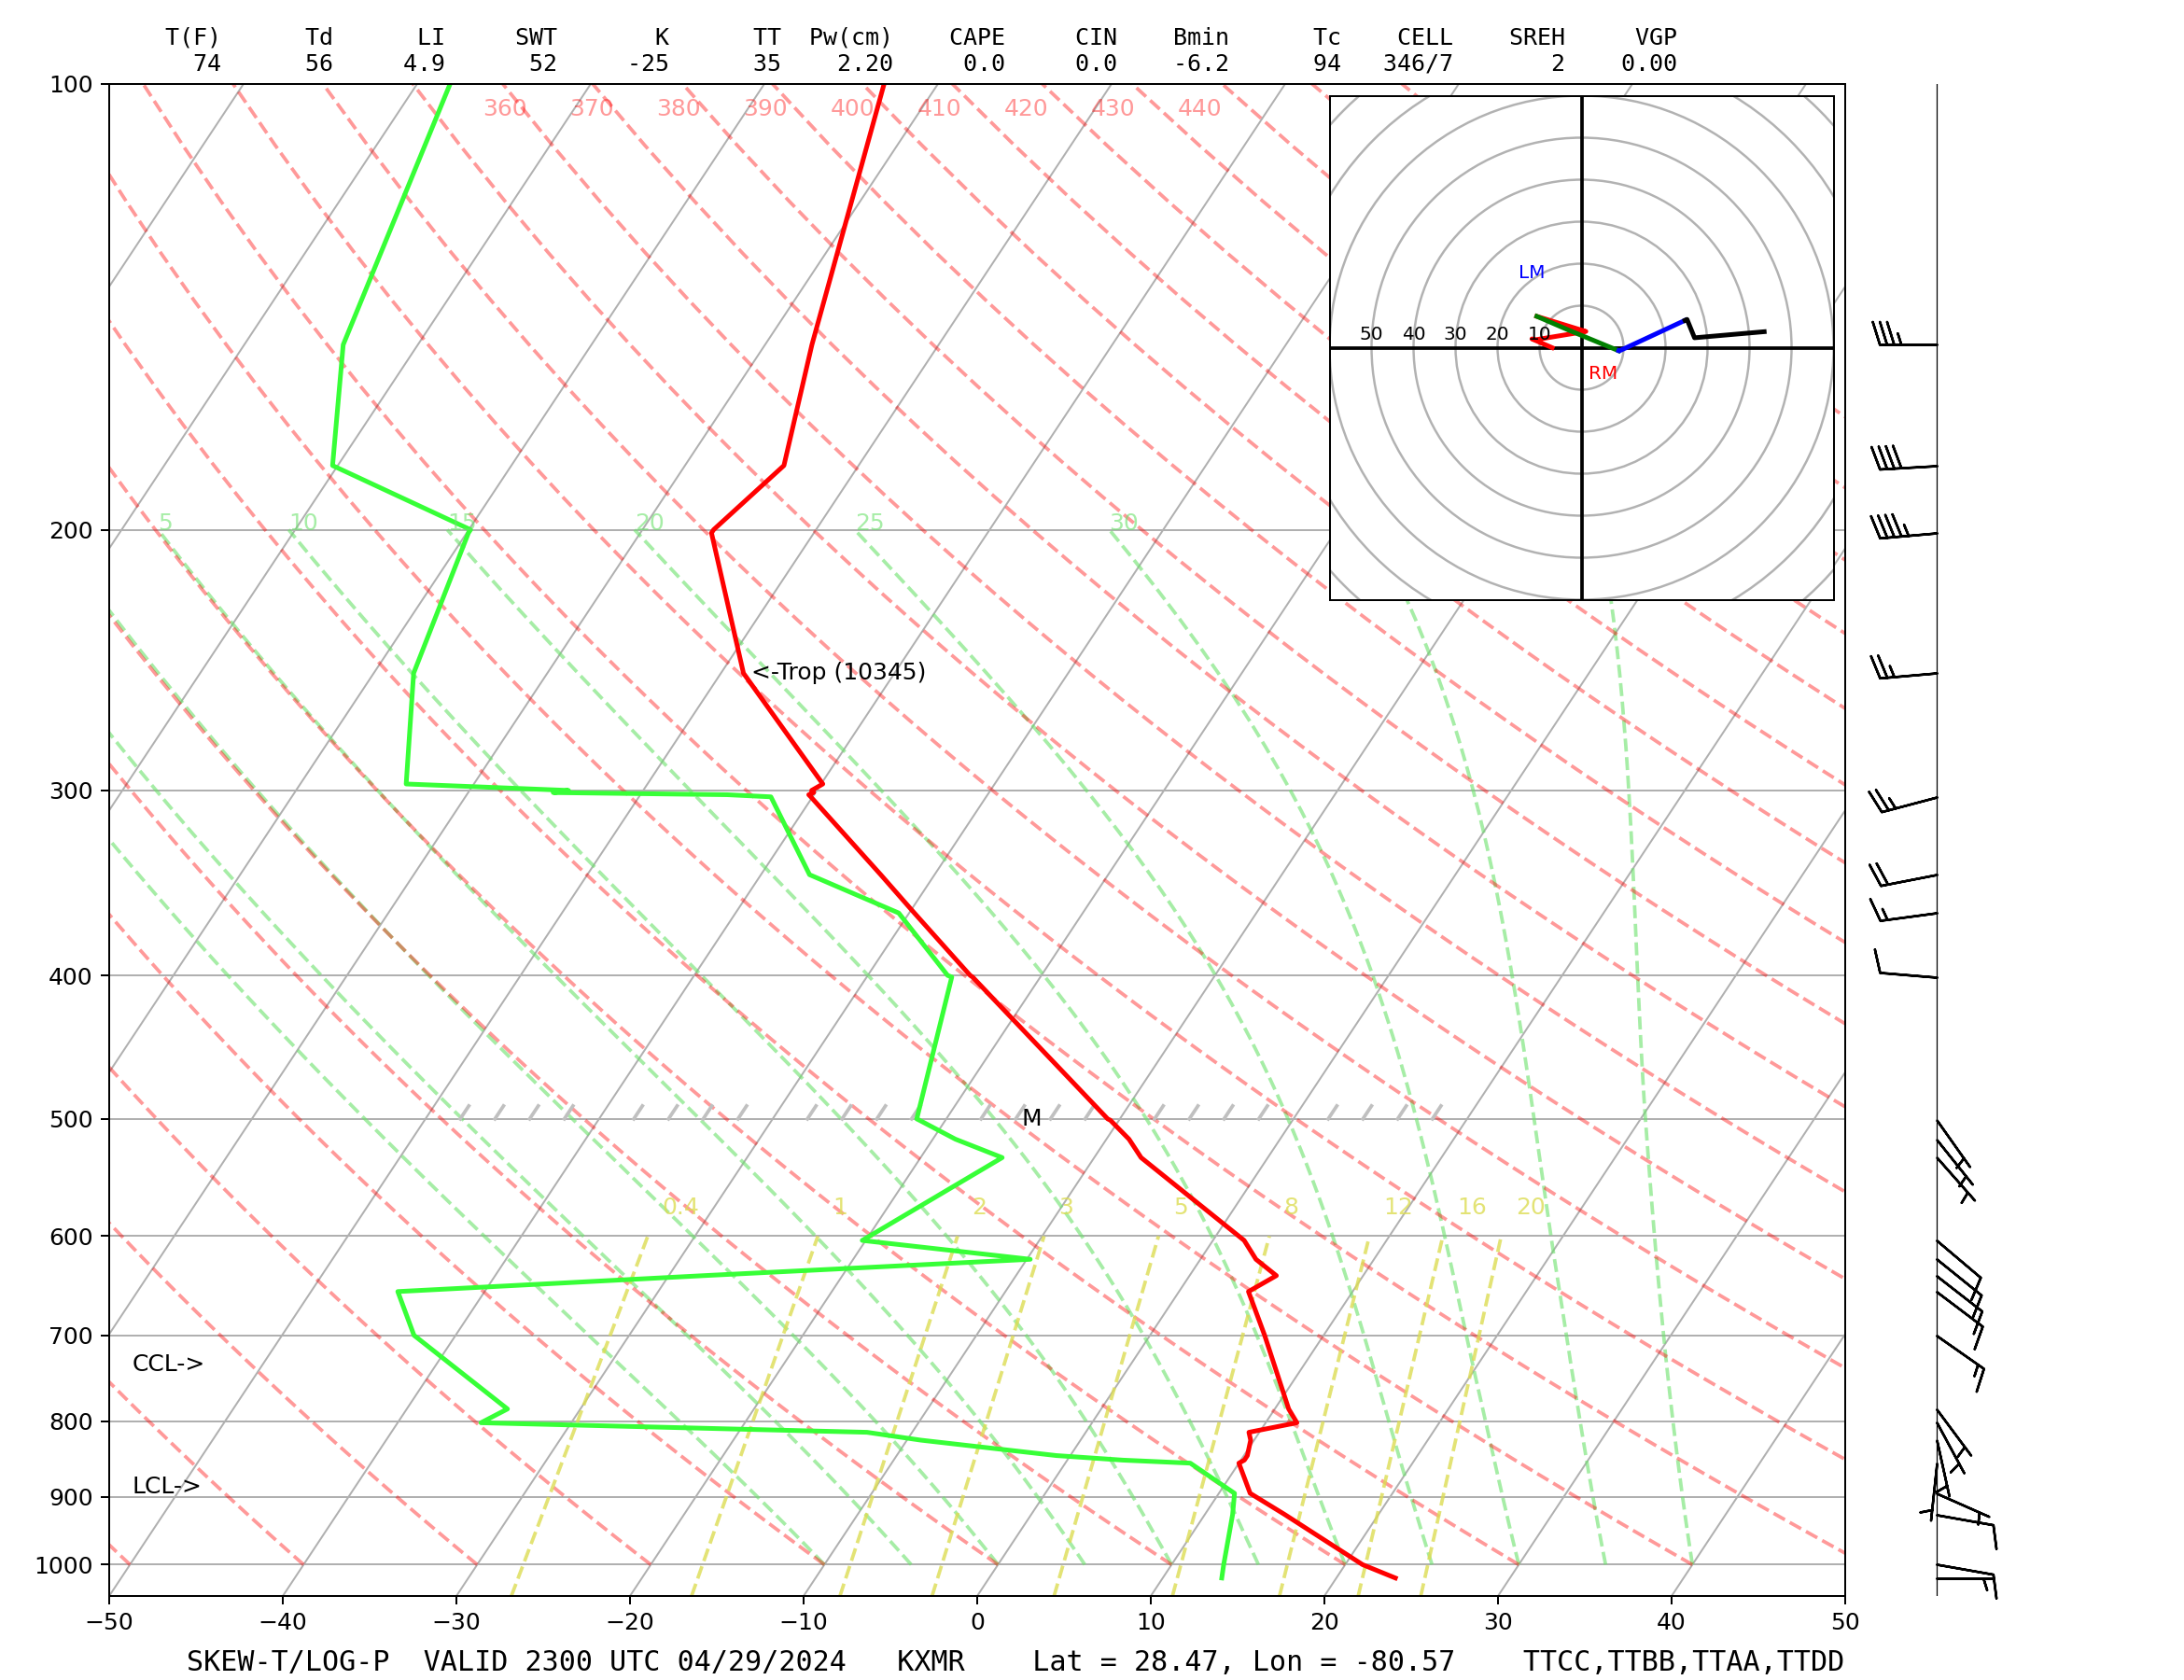
The table above is for upper-air sounding SKEW-T plots by region for the latest / current runs. Simply click the link for the sounding you wish to view for any of the available locations. All links in the table above have been provided by the NATIONAL CENTER FOR ATMOSPHERIC RESEARCH site and the link to their site has been provided HERE.
| SHORTHAND | LONG-DESCRIPTION | RAW | CONTOURS |
| 200SPD | 200 mb Wind Speed Plot | RAW | CONTOURS |
| 250SPD | 250 mb Wind Speed Plot | RAW | CONTOURS |
| 300SPD | 300 mb Wind Speed Plot | RAW | CONTOURS |
| 500SPD | 500 mb Wind Speed Plot | RAW | CONTOURS |
| 850SPD | 850 mb Wind Speed Plot | RAW | CONTOURS |
| 925SPD | 925 mb Wind Speed Plot | RAW | CONTOURS |
The table above is for various upper air contour plots for the current conditions and mandatory heights. Simply click on the image you wish to view ("RAW" for rawinsonde plots and "CONTOURS" for a contour map) for any of the available shorthand codes and times All links in the table above have been provided by the NATIONAL CENTER FOR ATMOSPHERIC RESEARCH site and the link to their site has been provided HERE.
| TIME | MSLP | 925-MB | 850-MB | 700-MB | 500-MB | 300-MB | 250-MB |
| 000 | AVN | AVN | AVN | AVN | AVN | AVN | AVN |
| 012 | AVN | AVN | AVN | AVN | AVN | AVN | AVN |
| 024 | AVN | AVN | AVN | AVN | AVN | AVN | AVN |
| 036 | AVN | AVN | AVN | AVN | AVN | AVN | AVN |
| 048 | AVN | AVN | AVN | AVN | AVN | AVN | AVN |
| 060 | AVN | AVN | AVN | AVN | AVN | AVN | AVN |
| 072 | AVN | AVN | AVN | AVN | AVN | AVN | AVN |
| 084 | AVN | AVN | AVN | AVN | AVN | AVN | AVN |
| 096 | AVN | AVN | AVN | AVN | AVN | AVN | AVN |
| 108 | AVN | AVN | AVN | AVN | AVN | AVN | AVN |
| 120 | AVN | AVN | AVN | AVN | AVN | AVN | AVN |
| 132 | AVN | AVN | AVN | AVN | AVN | AVN | AVN |
| 144 | AVN | AVN | AVN | AVN | AVN | AVN | AVN |
| 144 | AVN | AVN | AVN | AVN | AVN | AVN | AVN |
| 168 | AVN | AVN | AVN | AVN | AVN | AVN | AVN |
| 180 | AVN | AVN | AVN | AVN | AVN | AVN | AVN |
| 192 | AVN | AVN | AVN | AVN | AVN | AVN | AVN |
The table above is for aviation (GFS) medium-range-forecast weather images based on mandatory heights given as constant pressure surfaces from sea level (MSLP), just above sea level at about 3,000 feet (925-MB), 5,000 feet (850-MB), 10,000 feet (700-MB), 18,000 feet (500-MB), 30,000 feet (300-MB), and 34,000 feet (240-MB). Forecasts are from time "000" (analysis) out to 192-hours (8 days) with 12 hour increments. Simply click on the image you wish to view for any of the available times (in hours) and heights (in MB) by clicking on the corresponding "AVN" link. All links in the table above have been provided by the NATIONAL CENTER FOR ATMOSPHERIC RESEARCH site and the link to their site has been provided HERE.
| CODE | DESCRIPTION | CURRENT | 01-HRS | 02-HRS | 03-HRS | 06-HRS | 09-HRS | 12-HRS | LOOP-ALL |
| 200-WND | 200 mb Winds Aloft | CUR | 01 | 02 | 03 | 06 | 09 | 12 | LOOP |
| 250-WND | 250 mb Winds Aloft | CUR | 01 | 02 | 03 | 06 | 09 | 12 | LOOP |
| 300-WND | 300 mb Winds Aloft | CUR | 01 | 02 | 03 | 06 | 09 | 12 | LOOP |
| 500-TMP | 500 mb Temperatures Aloft | CUR | 01 | 02 | 03 | 06 | 09 | 12 | LOOP |
| 500-WND | 500 mb Winds Aloft | CUR | 01 | 02 | 03 | 06 | 09 | 12 | LOOP |
| 700-TMP | 700 mb Temperatures Aloft | CUR | 01 | 02 | 03 | 06 | 09 | 12 | LOOP |
| 700-WND | 700 mb Winds Aloft | CUR | 01 | 02 | 03 | 06 | 09 | 12 | LOOP |
| 850-TMP | 850 mb Temperatures Aloft | CUR | 01 | 02 | 03 | 06 | 09 | 12 | LOOP |
| 925-WND | 925 mb Winds Aloft | CUR | 01 | 02 | 03 | 06 | 09 | 12 | LOOP |
The table above is for RUC (Rapid Update Cycle model) plots of various plots aloft for mandatory pressure heights (where 925, 850, 700, 500 mb plots are available for winds and temperatures and 300, 250, and 200 mb are available for winds only) with current, 1-hour, 2-hours, 3-hours, 6-hours, 9-hours, and 12-hours out, plus a loop for all times option. Simply click on the image you wish to view for any of the available codes and times by clicking on the corresponding "CUR", "01", "02", "03", "06", "09", "12", or "LOOP" link. All links in the table above have been provided by the UCAR / NCAR site in Boulder, Colorado and the link to their site has been provided HERE.
| CODE | DESCRIPTION | CURRENT | 01-HRS | 02-HRS | 03-HRS | 06-HRS | 09-HRS | 12-HRS | LOOP-ALL |
| CAPE | CAPE And CIN Plots | CUR | 01 | 02 | 03 | 06 | 09 | 12 | LOOP |
| MCONV | Moisture Convergence And Lifted Index | CUR | 01 | 02 | 03 | 06 | 09 | 12 | LOOP |
| SRH | Storm-Relative Helicity | CUR | 01 | 02 | 03 | 06 | 09 | 12 | LOOP |
| UVV-MIX | Vertical Motion And Mixing Ratio | CUR | 01 | 02 | 03 | 06 | 09 | 12 | LOOP |
The table above is for RUC (Rapid Update Cycle model) plots of special severe index plots with current, 1-hour, 2-hours, 3-hours, 6-hours, 9-hours, and 12-hours out, plus a loop for all times option. Simply click on the image you wish to view for any of the available codes and times by clicking on the corresponding "CUR", "01", "02", "03", "06", "09", "12", or "LOOP" link. All links in the table above have been provided by the UCAR / NCAR site in Boulder, Colorado and the link to their site has been provided HERE.
| CODE | REGION-COVERED | CENTERED-OVER | LINK |
| USA | US Entire Continental United States | CONUS | MAP |
| ABQ | US Desert Southwest Region | Arizona | MAP |
| AK | Alaska Region | Alaska | MAP |
| ALB | US Northeastern Region | New York | MAP |
| AUS | US Southern Plains | Texas | MAP |
| BWI | US Mid-Atlantic Region | Baltimore | MAP |
| COD | US Northern Rockies | Wyoming | MAP |
| CLT | US Eastern Region | North Carolina | MAP |
| DEN | US Central Rockies | Colorado | MAP |
| DTW | US Great Lakes Region | Michigan | MAP |
| EVV | US Ohio Valley Region | Indiana | MAP |
| ICT | US Central Plains | Kansas | MAP |
| LAS | US Pacific Southwest Region | California | MAP |
| LIT | US Lower Mississippi Valley | Arkansas | MAP |
| LWS | US Pacific Northwest Region | Washington | MAP |
| MGM | US Southeastern Region | Alabama | MAP |
| MSP | US Northern Midwest Region | Wisconsin | MAP |
| PIR | US Northern Plains | South Dakota | MAP |
| TPA | US Florida Region | Florida | MAP |
| WMC | US Pacific West Region | Oregon | MAP |
The table above is for surface observations in standard meteorological format (graphical) by region. Simply click on the image you wish to view for any of the regions available by clicking on the corresponding "MAP" link. All links in the table above have been provided by the UCAR / NCAR site in Boulder, Colorado and the link to their site has been provided HERE.
| CODE | DESCRIPTION | CURRENT | 01-HRS | 02-HRS | 03-HRS | 06-HRS | 09-HRS | 12-HRS | LOOP-ALL |
| CLOUDS | Cloud Cover And Composition | CUR | 01 | 02 | 03 | 06 | 09 | 12 | LOOP |
| DEWP | Surface Dewpoint | CUR | 01 | 02 | 03 | 06 | 09 | 12 | LOOP |
| PRCP | Surface Precipitation | N/A | 01 | 02 | 03 | 06 | 09 | 12 | LOOP |
| PTYP | Surface Precipitation Type | N/A | 01 | 02 | 03 | 06 | 09 | 12 | LOOP |
| TEMP | Surface Temperature | CUR | 01 | 02 | 03 | 06 | 09 | 12 | LOOP |
| THET | Surface Theta-E | CUR | 01 | 02 | 03 | 06 | 09 | 12 | LOOP |
| WIND | Surface Wind And MSL Pressure | CUR | 01 | 02 | 03 | 06 | 09 | 12 | LOOP |
The table above is for RUC (Rapid Update Cycle model) plots of various surface parameters with current, 1-hour, 2-hours, 3-hours, 6-hours, 9-hours, and 12-hours out, plus a loop for all times option. Simply click on the image you wish to view for any of the available codes and times by clicking on the corresponding "CUR", "01", "02", "03", "06", "09", "12", or "LOOP" link. All links in the table above have been provided by the UCAR / NCAR site in Boulder, Colorado and the link to their site has been provided HERE.
| SHORTHAND | LONG-DESCRIPTION | LINK |
| DAY1 | Day One Convective Outlook | LNK |
| DAY1HAIL | Day One Severe Hail Probabilities | LNK |
| DAY1TOR | Day One Tornado Probabilities | LNK |
| DAY1WND | Day One Severe Wind Probabilities | LNK |
| DAY2 | Day Two Convective Outlook | LNK |
| DAY2SVR | Day Two Severe Weather Probabilities | LNK |
| DAY3 | Day Three Convective Outlook | LNK |
| DAY3SVR | Day Three Severe Weather Probabilities | LNK |
| DAY4 | Day 4-8 Thunderstorm Outlooks | LNK |
| MD | Current Mesoscale Discussion | LNK |
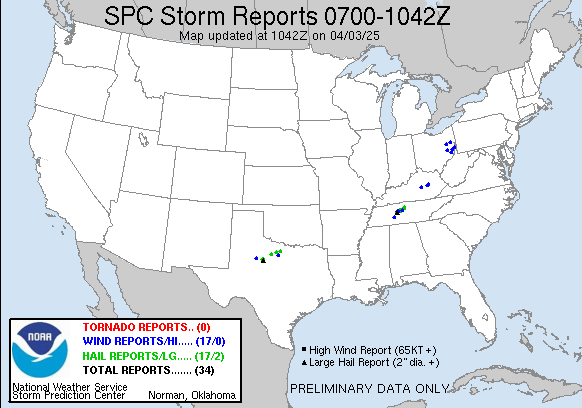
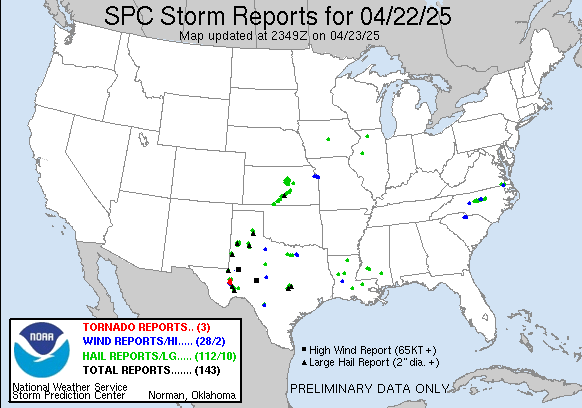
| REP1 | Today's Storm Reports (Last 3 Hours) | LNK |
| REP2 | Today's Storm Reports (since AM) | LNK |
| REP3 | Yesterday's Storm Reports | LNK |
| WW | All Severe Weather Watches | LNK |
| WXFIRE | Fire Weather Outlook | LNK |
The table above is for the SPC (Storm Prediction Center) forecasting products. The standard convective outlooks as well as watches, warnings, as well as discussions and other important forecast products from SPC. Simply click on the image you wish to view for any of the available shorthand and description by clicking on the corresponding "LNK" link. All links in the table above have been provided by the SPC site in Norman, Oklahoma and the link to their site has been provided HERE.
| SHORTHAND | LONG-DESCRIPTION | LINK1 | LINK2 |
| ATL-TWO | Atlantic Tropical Weather Outlook | TXT | MAP |
| ATL-TWD | Atlantic Tropical Weather Discussion | TXT | MAP |
| WATL | Western Atlantic Tropical Weather Outlook | 2-Day | 5-Day |
| EPAC | Eastern Pacific Tropical Weather Outlook | 2-Day | 5-Day |
| CPAC | Central Pacific Tropical Weather Outlook | 2-Day | 5-Day |
| SATELLITE | NHC / NOAA GOES Satellite Images | FLOATERS | NESDIS |
| JTWC | JOINT-Typhoon JTC Products | JTWC-PAGE | GLOBAL |
The table above is for the popular National Hurricane Center forecasting, satellite (also provided by NESDIS), and discussion products. Simply click on the image or product (based on two links for each entry) you wish to view for any of the available shorthand link. All links in the table above have been provided by the NHC (National Hurricane Center) site in Miami, Florida and the link to their site has been provided HERE.
| TIME | OTIS-SST | OTIS-ANOM | GLOBAL | N-PACIFIC | S-PACIFIC | N-ATLANTIC | S-ATLANTIC | INDIAN | EUROPE | ARCTIC | ANTARCTIC |
| 000 | SST | ANOM | WAVE | WAVE | WAVE | WAVE | WAVE | WAVE | WAVE | WAVE | WAVE |
| 012 | N/A | N/A | WAVE | WAVE | WAVE | WAVE | WAVE | WAVE | WAVE | WAVE | WAVE |
| 024 | N/A | N/A | WAVE | WAVE | WAVE | WAVE | WAVE | WAVE | WAVE | WAVE | WAVE |
| 036 | N/A | N/A | WAVE | WAVE | WAVE | WAVE | WAVE | WAVE | WAVE | WAVE | WAVE |
| 048 | N/A | N/A | WAVE | WAVE | WAVE | WAVE | WAVE | WAVE | WAVE | WAVE | WAVE |
| 060 | N/A | N/A | WAVE | WAVE | WAVE | WAVE | WAVE | WAVE | WAVE | WAVE | WAVE |
| 072 | N/A | N/A | WAVE | WAVE | WAVE | WAVE | WAVE | WAVE | WAVE | WAVE | WAVE | >
| 084 | N/A | N/A | WAVE | WAVE | WAVE | WAVE | WAVE | WAVE | WAVE | WAVE | WAVE |
| 096 | N/A | N/A | WAVE | WAVE | WAVE | WAVE | WAVE | WAVE | WAVE | WAVE | WAVE |
| 108 | N/A | N/A | WAVE | WAVE | WAVE | WAVE | WAVE | WAVE | WAVE | WAVE | WAVE |
| 120 | N/A | N/A | WAVE | WAVE | WAVE | WAVE | WAVE | WAVE | WAVE | WAVE | WAVE |
| 132 | N/A | N/A | WAVE | WAVE | WAVE | WAVE | WAVE | WAVE | WAVE | WAVE | WAVE |
| 144 | N/A | N/A | WAVE | WAVE | WAVE | WAVE | WAVE | WAVE | WAVE | WAVE | WAVE |
| ALL | N/A | N/A | LOOP | LOOP | LOOP | LOOP | LOOP | LOOP | LOOP | LOOP | LOOP |
The table above is for the FNMOC (US Navy Fleet Numerical Modeling and Oceanography Center) forecasts for sea-surface temperatures and significant waveheights. Simply click on the image you wish to view for any of the available regions at the top for the forecast times to the lefy, which start at "000" (initial) and go out to 144 hours (6 days) on increments of 12 hours, by clicking on the corresponding "ANOM", "SST", "WAVE", or "LOOP" link (loop options not available on all links). All links in the table above have been provided by the US Navy FNMOC site and the link to their site has been provided HERE.
| STATE | STATE-NAME | ALL-WARNINGS |
| US | Entire USA | WARN |
| AL | Alabama | WARN |
| AK | Alaska | WARN |
| AS | America Samoa | WARN |
| AZ | Arizona | WARN |
| AR | Arkansas | WARN |
| CA | California | WARN |
| CO | Colorado | WARN |
| CT | Connecticut | WARN |
| DE | Delaware | WARN |
| DC | District of Columbia | WARN |
| FL | Florida | WARN |
| GA | Georgia | WARN |
| GU | Guam | WARN |
| HI | Hawaii | WARN |
| ID | Idaho | WARN |
| IL | Illinois | WARN |
| IN | Indiana | WARN |
| IA | Iowa | WARN |
| KS | Kansas | WARN |
| KY | Kentucky | WARN |
| LA | Louisiana | WARN |
| ME | Maine | WARN |
| MP | Marianas | WARN |
| MD | Maryland | WARN |
| MA | Massachusetts | WARN |
| MI | Michigan | WARN |
| UM | Midway Island | WARN |
| MN | Minnesota | WARN |
| MS | Mississippi | WARN |
| MO | Missouri | WARN |
| MT | Montana | WARN |
| NV | Nevada | WARN |
| NE | Nebraska | WARN |
| NH | New Hampshire | WARN |
| NJ | New Jersey | WARN |
| NM | New Mexico | WARN |
| NY | New York | WARN |
| NC | North Carolina | WARN |
| ND | North Dakota | WARN |
| OH | Ohio | WARN |
| OK | Oklahoma | WARN |
| OR | Oregon | WARN |
| PA | Pennsylvania | WARN |
| PR | Puerto Rico | WARN |
| RI | Rhode Island | WARN |
| SC | South Carolina | WARN |
| SD | South Dakota | WARN |
| TN | Tennessee | WARN |
| TX | Texas | WARN |
| UT | Utah | WARN |
| VT | Vermont | WARN |
| VI | Virgin Islands | WARN |
| VA | Virginia | WARN |
| WA | Washington | WARN |
| WV | West Virginia | WARN |
| WI | Wisconsin | WARN |
| WY | Wyoming | WARN |
The table above is for the NWS (Interactive Weather Information Network) active warnings and advisories by state. Simply click on the WARN link to view ALL available warnings (or advisories) for the state code to the left. All links in the table above have been provided by the NATIONAL WEATHER SERVICE site and the link to them has been provided HERE.
| SHORTHAND | LONG-DESCRIPTION | CURRENT | LOOP |
| HEAT | Heat Index | IMG | LOOP |
| CPARMS | Convective Parameters (CAPE and LI) | IMG | LOOP |
| DEWPOINT | Surface Dewpoint | IMG | LOOP |
| HEL3KM | 0-3 km Helicity | IMG | LOOP |
| HUMIDITY | Surface Relative Humidity | IMG | LOOP |
| MCONV | Moisture (Flux) Convergence | IMG | LOOP |
| RHWINDS | 1-km Relative Humidity And Winds | IMG | LOOP |
| SHEAR | Low-Level (Boundary Layer) Shear Vector | IMG | LOOP |
| STEERING | 850-650 Steering Wind And Mean RH | IMG | LOOP |
| TEMP | Surface Temperature | IMG | LOOP |
| THETAE | 950-700 Theta-E Plot | IMG | LOOP |
| WINDS | Surface Wind Plot | IMG | LOOP |
The table above is for the experimental mesoscale forecasting / nowcasting products offerend by the National Weather Service site in Melborne, Florida. Simply click on the corresponding "IMG" or "LOOP" link to choose that product or view a loop of it (history). All links in the table above have been provided by the NWS (National Weather Service) office in MLB (Melborne), Florida and the link to their site has been provided HERE.
The miscellaneous site(s) shown above are either private (subscription based) and / or require a membership to access them fully.
The miscallaneous site(s) shown above are just some extras I threw in for this page.
HTML File "stwarns.htm" - Developed By Chris Collura
To Return To The HOME Page Of This Site Click The "INDEX.HTM" Link Here!